Bitcoin May Be Nearing a Bottom Despite Bearish Long-Term Average Signal
The 50- and 100-week moving averages are getting close to a bear cross, but historically that has often lined up with a bottom. What does that say about Bitcoin now?
Key Takeaways
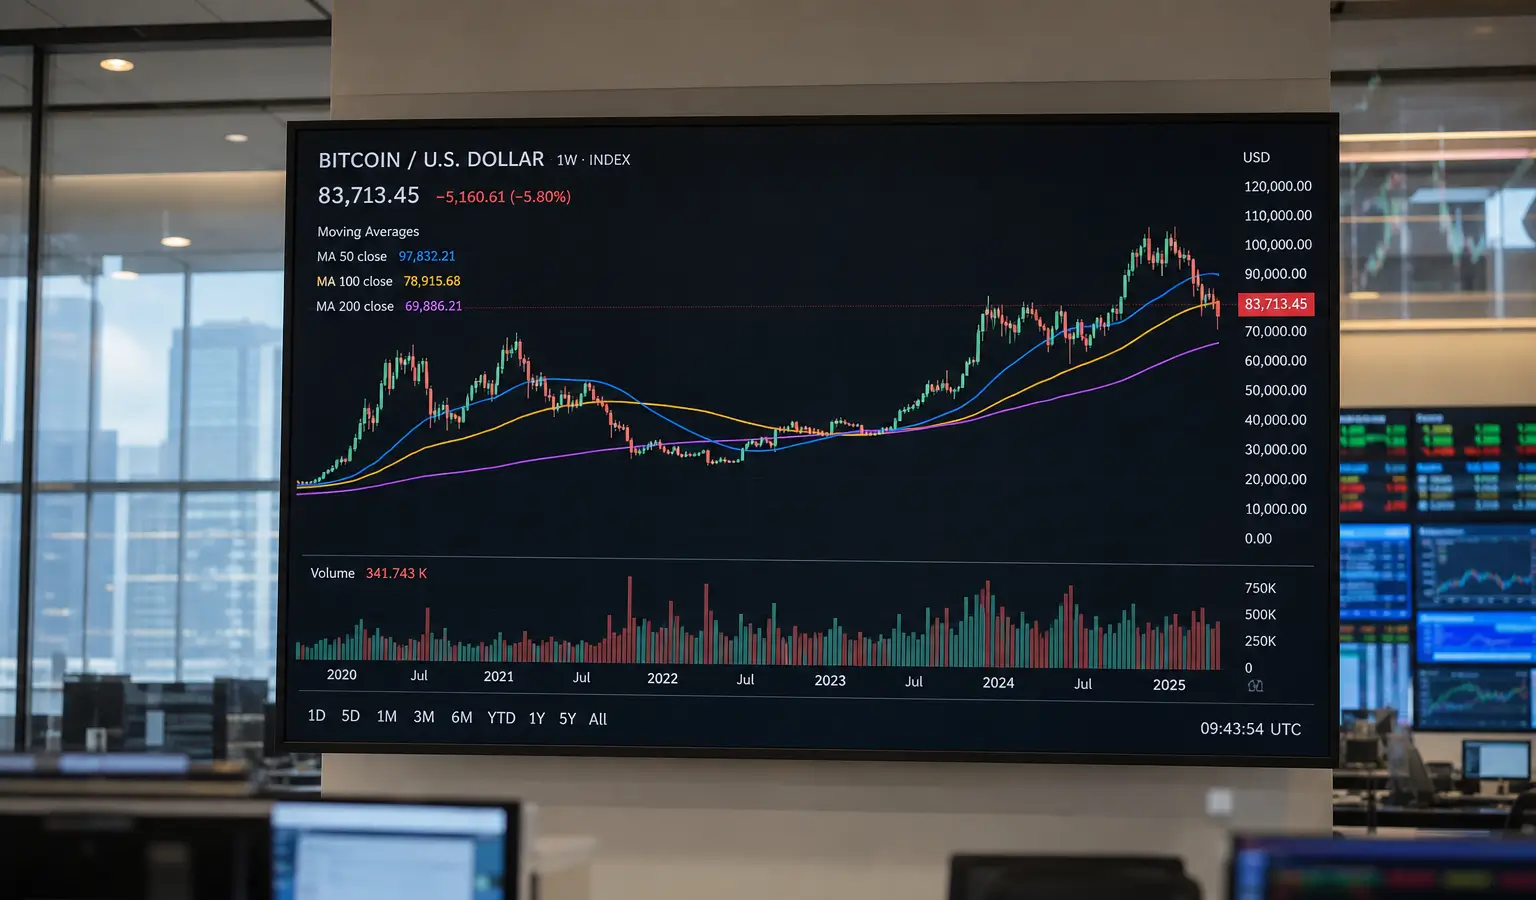
- Bitcoin may be nearing a bottom, while the 50-week SMA is almost crossing below the 100-week SMA.
- In Bitcoin's history, earlier bear crosses often came before a market bottom and a rally of about three years.
- Outside factors like interest rates, ETF flows, and corporate policy are still important for where the price goes next.
Bitcoin looks close to a bottom, even though technical indicators are flashing a bearish signal in the short term. Bitcoin's 50-week simple moving average (SMA) is about to drop below the 100-week SMA, which in technical analysis is known as a "bear cross." This signal could happen as soon as next week. While that may sound scary to many investors, history suggests that this kind of crossover often marks the end of a downtrend and the start of a long-term uptrend.
Historical Meaning of the Bear Cross
In the past, Bitcoin has shown this kind of bear cross three times, and each time it was followed by a market bottom and then a rally that lasted about three years. That pattern suggests the current bear market may be getting close to its low point. It is important to remember that these averages look backward, since they reflect the average price over 50 and 100 weeks, respectively. So the upcoming bear cross is mostly a reflection of Bitcoin's steep price drop from about $126,000 (€110,000) in October to nearly $60,000 (€52,400). Because of that, the signal itself has little predictive power, but it can still show that the market has mostly absorbed the downside phase.
Technical Context and Market Forces
By the time a bear cross happens, most speculators have usually already exited and capitulation has often taken place. That makes the signal useful for traders as a possible bottom indicator. Still, historical patterns do not guarantee what happens next. Outside factors like interest rates, ETF flows, and the policies of major companies like Strategy (MSTR) remain crucial for Bitcoin's future price moves. At the time of writing, Bitcoin is trading around $62,400 (€54,500), with the 50-week SMA at $89,771 (€78,400) and the 100-week SMA at $88,397 (€77,200).
Why This Matters for European Crypto Investors
For European investors, this development may matter because it suggests Bitcoin could be nearing a stabilization point after a period of heavy volatility. That could affect sentiment and trading activity across the European crypto market. It also highlights why it is important to watch long-term indicators alongside macroeconomic factors to get a better sense of the market backdrop.