Bitcoin Remains Below Key Onchain Levels
BTC is trading below the 200-day and 128-day averages, while onchain support sits closer to $50,000 to $53,000. That keeps sentiment weak and adds pressure on altcoins.
Key Takeaways
- Bitcoin is still below $60,000 and, according to onchain analysts, remains stuck in a weak no-man’s-land zone.
- Major technical markers such as the True Mean Price, 200-Day Moving Average, and Short Term Holder Cost Basis are all above the current price.
- Onchain support sits below the market at the Realized Price and Long Term Holder Cost Basis, while the MVRV Z-Score is still above the levels seen in earlier capitulation phases.
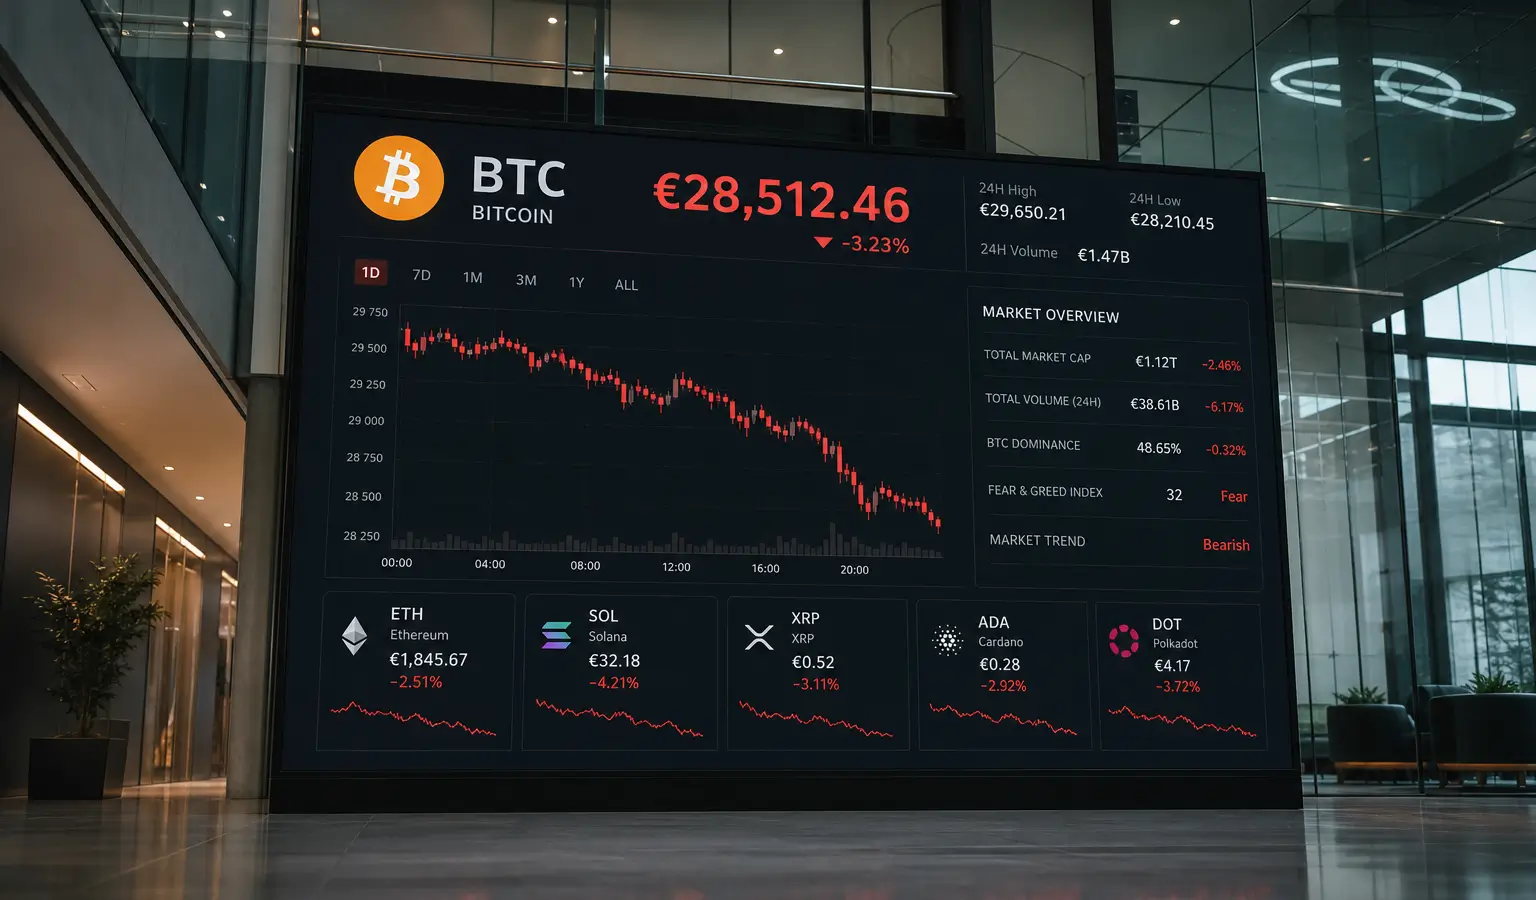
Bitcoin is still trading below $60,000 (€52,600), leaving it in what onchain analysts often describe as no man’s land. The price is caught between major support and resistance zones, while a number of technical and onchain indicators remain above spot. For now, that keeps the BTC outlook weak and leaves the market biased to the downside.
Key Levels Are Higher
The True Mean Price is about $76,300 (€66,900) and reflects the average acquisition cost of coins after adjusting for lost or inactive supply. The 200-Day Moving Average, at $75,500 (€66,200), is also well above the current price. The same is true for the 128-Day Moving Average at $70,900 (€62,200) and the Short Term Holder Cost Basis at $69,600 (€61,000).
Traders often use those levels to gauge whether the market is shifting from a bull trend into a bear trend. As long as Bitcoin stays below them, buyers have little evidence that the broader structure has improved.
Onchain Support Below the Price
Several important onchain support levels are sitting underneath the current price. The Long Term Holder Cost Basis is at $49,900 (€43,800), the Coin Time Price is $51,700 (€45,300), and the Realized Price is $53,200 (€46,700). The Realized Price, in particular, is often treated in bear markets as a key area where the market has found support before.
The MVRV Z-Score offers another clue. It is currently at 0.23. In past cycles, around market tops and bear market bottoms, that indicator often fell to zero or below, which suggests Bitcoin has not yet reached the kind of deep capitulation seen in earlier downturns.
What This Could Mean for Europe
For European crypto investors, the setup matters because Bitcoin still drives a large share of the broader market’s direction. If BTC keeps trading below these levels, sentiment around altcoins, trading volume, and risk appetite on crypto exchanges could also stay under pressure. Even so, history shows that previous bear markets often went much further, with drawdowns ranging from 50 percent to well over 80 percent from the peak. In 2022, for instance, Bitcoin dropped about 77 percent from the November 2021 high to around $15,500 (€13,600), a reminder of how severe these cycles can become.
The recent outflows from spot Bitcoin ETFs also suggest that institutional demand is not providing much support to the price right now.