Bitcoin Rises 13% After Fed Hike and ETF Inflows
Spot Bitcoin ETFs pulled in $2.31 billion over just a few days, while short positions got squeezed. The price also broke out of a technical pattern after the Fed decision.

Key Takeaways
- Bitcoin has risen about 13% since the Federal Reserve’s rate hike on September 16.
- Spot Bitcoin ETFs pulled in a total of $2.31 billion between September 17 and 22, while short positions were liquidated.
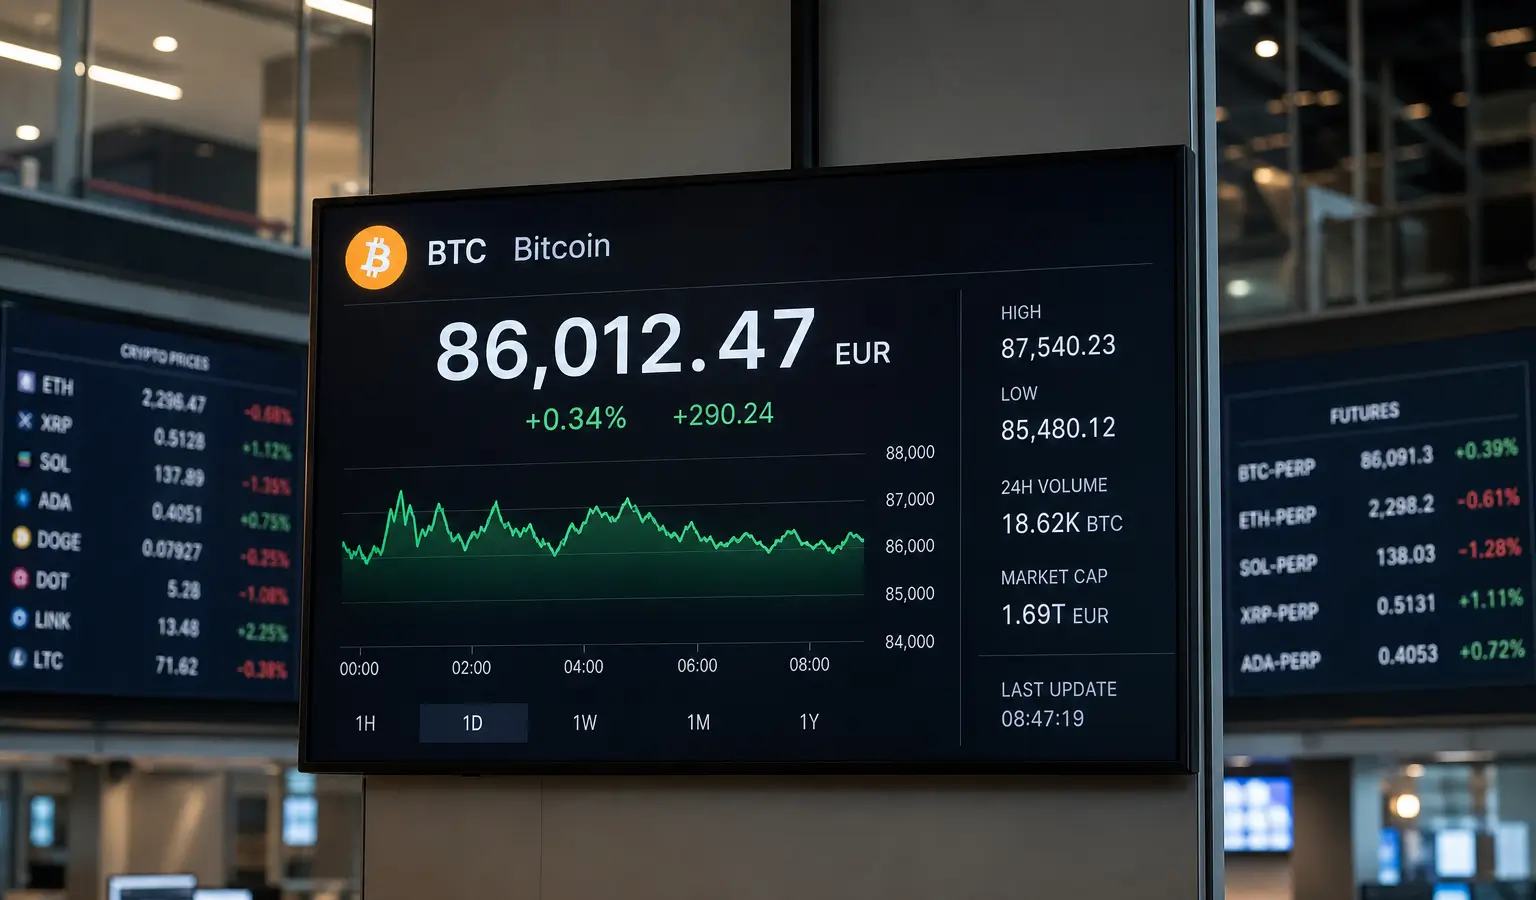
- The price broke out of an inverse head and shoulders pattern; resistance is around $86,935 and support is around $84,045.
Bitcoin has risen about 13% since the Federal Reserve raised rates on September 16. Wall Street funds, in particular, came back as buyers after previously pulling money out of Bitcoin. The market had already mostly priced in the hike, and that helped the recovery.
Why Funds Came Back
The first reason was simple: uncertainty around the Fed decision disappeared. Funds that had shown heavy outflows before no longer had to wait for clarity. That lined up with the idea that the market had already absorbed the bad news.
Higher rates also scared buyers less. The U.S. two-year yield climbed to 4.76% on September 18 and 21, exactly on the days Bitcoin rose sharply. For comparison, Bitcoin has historically reacted less strongly to Treasury yields than gold, which reinforces the view that some investors see the coin more as a hard asset.
ETFs and Short Squeeze
Spot Bitcoin ETFs pulled in a total of $2.31 billion (€2 billion) between September 17 and 22. On September 18, Bitcoin rose 5.9% with $433 million (€378 million) in inflows. On September 21, the price climbed 6.7% while funds added $999 million (€871 million). Those two sessions accounted for almost the entire 13.2% gain through September 22.
On top of that, short positions got hit. On September 21, $262 million (€229 million) worth of bets against Bitcoin were liquidated in one hour. Closing shorts means buying, and that pushed demand even higher at the time.
What the Price Is Showing Now
Bitcoin broke out of an inverse head and shoulders pattern that had been forming since February. On September 21, the price moved through the neckline on the heaviest daily volume since August 21. After that, the pullback stayed limited to 0.5% on September 22, much smaller than the 3.3% drop on September 15.
The first hurdle is around $86,935 (€75,800). A daily close above that level opens the door, according to the analysis, to $89,825 (€78,400) and then $93,940 (€82,000). The pattern’s measured move even points toward $117,247 (€102,300), close to the all-time high of $126,080 (€110,000).
On the downside, support sits around $84,045 (€73,300). Below that, the neckline around $82,000 (€71,500) comes back into view. The UTXO data also show that relatively few coins were bought above the current price, which means fewer investors need to sell at breakeven. Earlier, a political breakthrough in Washington already provided extra support around the same price area, after Bitcoin kept trading near $86,900 (€75,800).