Bitcoin Sharpe Ratio Falls to Lowest Level Since 2022
CryptoQuant says BTC’s 365-day Sharpe Ratio has fallen to -21, a rare deep reading that points to weak risk-adjusted performance.
Key Takeaways
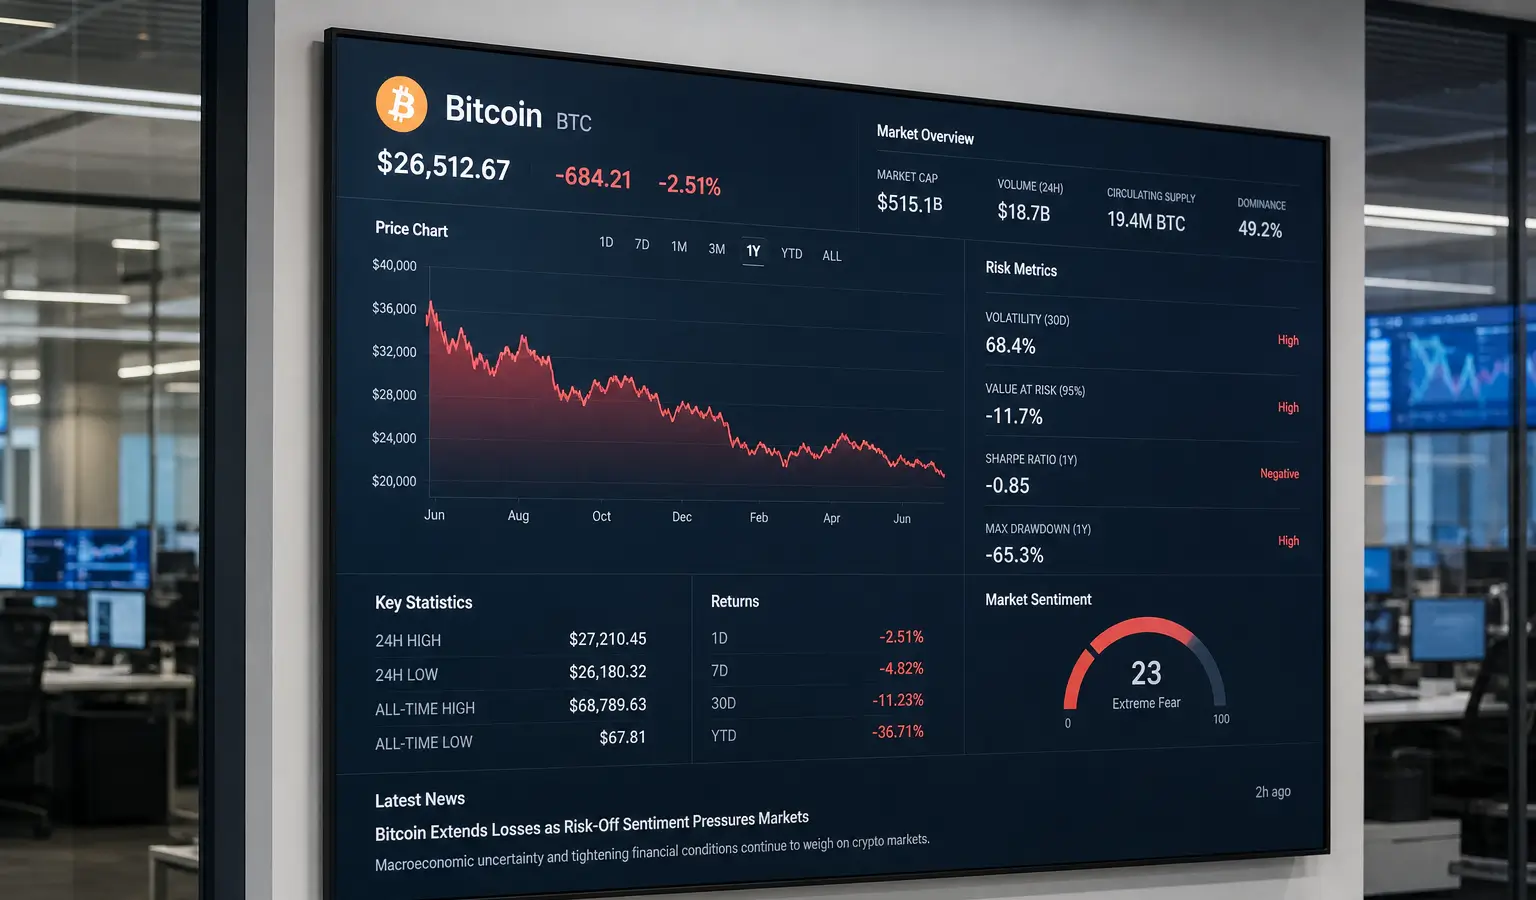
- Bitcoin is already down 28% this year, and its Sharpe Ratio fell to -21 at the end of June, the lowest level since late 2022.
- A negative Sharpe Ratio means Bitcoin’s volatility during that period was not matched by a solid return.
- Historically, similar Sharpe levels have lined up with bear market bottoms in 2015, 2019, and 2022.
Bitcoin is already down 28% this year, and that decline looks even starker through the lens of the Sharpe Ratio. The risk-adjusted return metric, which professional investors use to weigh performance against volatility, dropped to -21 at the end of June, its weakest reading since late 2022.
Deep Loss for BTC
CryptoQuant data shows Bitcoin’s 365-day rolling Sharpe Ratio recently slipped to just below -20. In practical terms, that means BTC’s volatility over the period was not rewarded with a strong enough return. The result was worse than what an investor could have earned from a risk-free asset, such as a 10-year U.S. Treasury note, which recently yielded around 4.45%.
The Sharpe Ratio was created by Nobel Prize winner William F. Sharpe and has become one of the standard tools for measuring risk-adjusted performance. It works by subtracting the risk-free rate from total return and then dividing the result by volatility. A higher score means more return for each unit of risk, while a negative reading suggests investors were not paid enough for the swings they took on.
Why This Matters for Investors
For professional investors, Bitcoin is not only a question of how far the price has fallen from a high. They also care about how much risk they are taking relative to the quality of the return. That is why a metric like the Sharpe Ratio matters, especially in a market where sharp moves are part of the norm.
The current reading is notable, but it is not without precedent in BTC’s history. Based on the context provided, Bitcoin still posted a 10-year Sharpe Ratio of 0.85, above the S&P 500’s 0.54 and gold’s 0.28. Even so, the metric has moved sharply over time, reaching 2.33 in 2014 and coming in at 0.97 over the past five years.
Historical Bottom Signal
A Sharpe Ratio near -20 is rare, and in the past it has often appeared when selling pressure was close to exhausting itself. Similar readings in 2015, 2019, and 2022 lined up with bear market bottoms and were followed by strong reversals. For market watchers, that makes the current level more of a warning flag on Bitcoin’s risk-reward profile than a direct price call.
Bitcoin is still facing pressure from weak institutional demand. That matches the picture from record ETF outflows, where onchain data and fund flows together pointed to a deep capitulation phase.