Bitcoin Shows 8 Capitulation Signals, but a Bottom Still Hasn't Appeared
VanEck sees stress among miners and holders at a loss, while U.S. spot Bitcoin ETPs are seeing inflows again. Historically, a bottom came later.
Key Takeaways
- Bitcoin is showing 8 of the 12 capitulation signals, but VanEck still does not see a convincing bottom.
- The price was around $64,300, about 49% below the all-time high, while miners and network activity are under pressure.
- Historically, signals like these only led to better returns over a longer period, with a possible accumulation phase between September and November.
Bitcoin is once again showing signals that have previously appeared near the end of heavy selloffs, but according to VanEck, that is still not a reason to call a bottom yet. The asset manager sees 8 of the 12 capitulation signals in the danger zone, while all 12 touched those levels at some point over the past three months.
Signals Point to Stress
The indicators measure, among other things, how far Bitcoin has fallen from its peak, how miners are doing, and how many holders are sitting on losses. According to VanEck, these signals are triggered when a reading falls into the lowest 15th percentile of its own history, with one exception: the price drawdown already counts once the drop is more than 35%.
Bitcoin was trading around $64,300 (€55,500) in Asian evening trading on Wednesday, about 49% below the all-time high. Since rebounding from a low of around $58,500 (€50,500) on June 30, the coin has mostly traded between about $62,300 (€53,800) and $66,500 (€57,400), while 30-day realized volatility has fallen back to 27.2% annualized.
History Does Not Call for Urgency
VanEck points out that similar setups have historically not been a strong short-term signal. When 8 to 12 indicators flashed at the same time, Bitcoin's average return over the following 90 days was 12.8% and over 180 days was 32%, both below the broader historical averages. The advantage only became clear over a one-year horizon.
That lines up with earlier cycles, in which the biggest declines lasted an average of 11 months, or 12.7 months if the small 2011 market is left out. Bitcoin is now in the tenth month of the decline from the October 2025 peak, which means a possible accumulation phase could fall between September and November, according to VanEck.
Miners Feel the Pressure
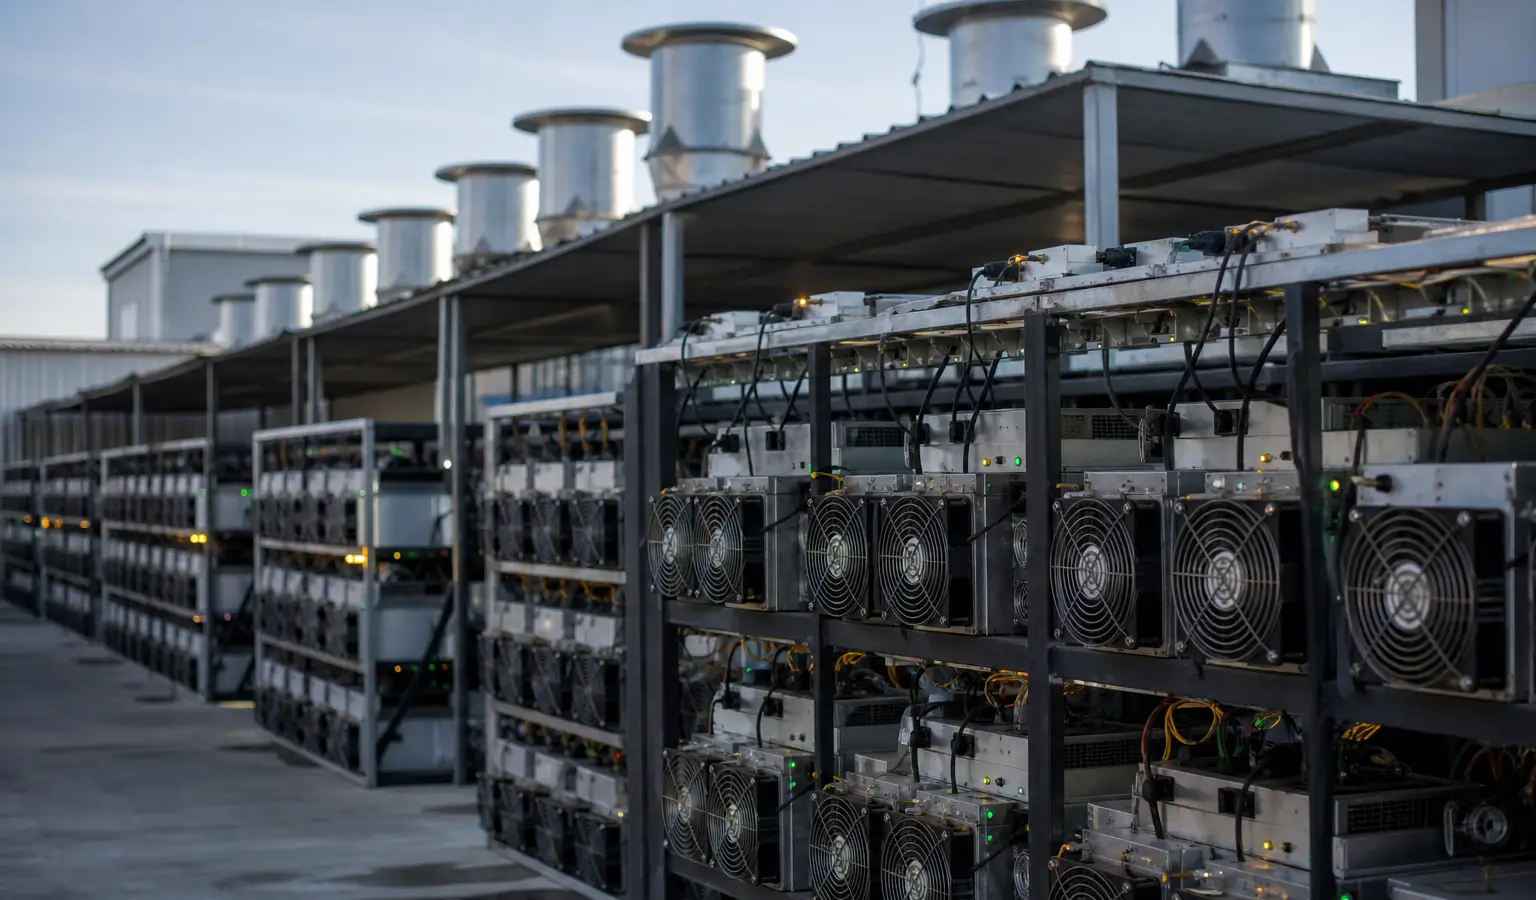
The pressure is especially visible among miners. Daily network revenue has fallen 46% this year, and mining difficulty has dropped 18.3% from the November 2025 peak, the sharpest decline since China cracked down hard on mining in 2021. That points to a clear drop in activity on the network.
At the same time, money flowed back into U.S. spot bitcoin exchange-traded products. Over the past 30 days, about $663 million (€573 million) came in, after roughly $2.4 billion (€2.1 billion) in outflows the month before. Trading volumes were still thin, with 30-day spot volumes 27% lower and sitting in the 10th percentile of the historical range.
For European crypto investors, the key point is that Bitcoin is in a phase where on-chain stress, miner pressure, and ETF flows are not pointing in the same direction. That could mean the market is still looking for direction, while the historical data mainly suggests that patience matters more here than quick conclusions.