Bitcoin Tests $66,000 as Volume Fades
The price got a boost from softer U.S. inflation, but there is still heavy supply around $66,000. Falling volume and weak ETF inflows are keeping the rally vulnerable.
Key Takeaways
- Bitcoin is trading around $64,500 after gaining about 3% on softer U.S. inflation data.
- Buying volume is fading, while a dense supply zone near $66,000 is the next major resistance.
- Whales are still relatively long, and the market is waiting for more confirmation through spot Bitcoin ETF inflows.
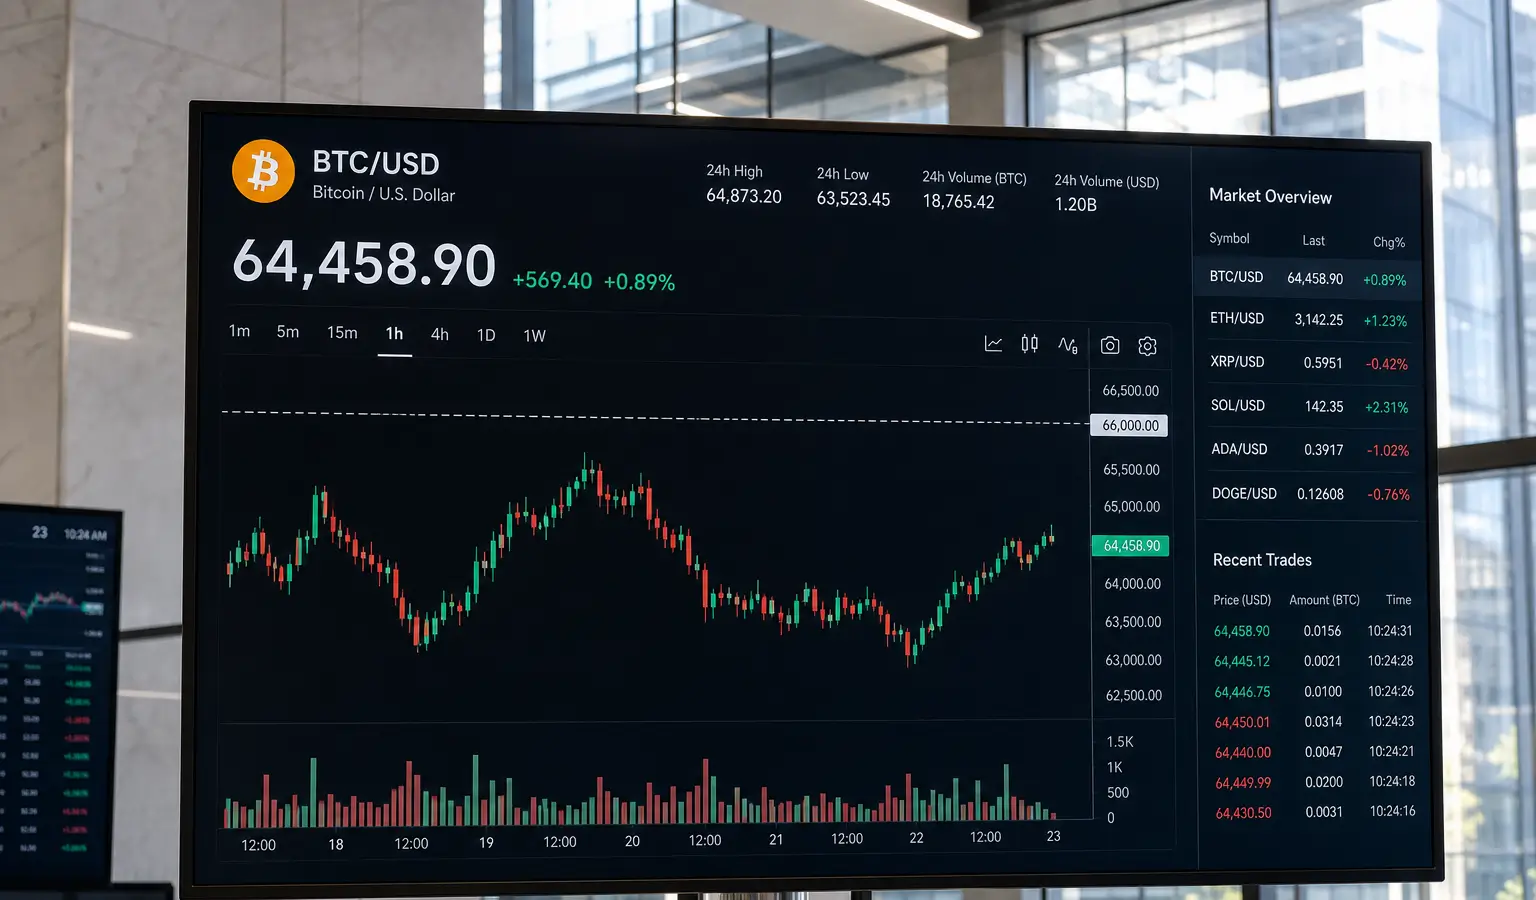
Bitcoin (BTC) is trading near $64,500 (€56,600), roughly 3% higher than it was a day ago. Softer U.S. inflation data helped push the price through a level that had capped it since mid-June. That keeps the two-week uptrend intact, but the move is still fragile because buying volume is thinning and a heavy supply area sits just above current prices.
Sentiment Remains Tense
The market is still sending mixed signals. The Crypto-Equity Fear Gap shows crypto at 25, which is deep in extreme fear territory, while fear in stocks remains subdued. In other words, the anxiety is mostly contained within crypto rather than spreading across the broader financial system.
Other indicators point the same way. High-yield credit spreads are at 2.69%, suggesting there is not much stress in credit markets. At the same time, the Liquidity Siphon Index is flashing outflow pressure, as stablecoin supply fell 0.35% over the past week and tokenization and IPO narratives drew more attention back to Wall Street.
Whales Stay Long
Positioning still looks fairly constructive for now. A metric that compares Bitcoin whales with smaller traders shows large holders are about 28% more long than retail traders, while both groups are broadly leaning in the same direction. That also fits with signs that long-term holders are still adding BTC.
On the chart, Bitcoin has been climbing inside an upward channel since early July, with a pattern of higher highs and higher lows. After the softer inflation reading, the coin moved back above a prior swing high, which suggests buyers still have the upper hand for now. Even so, there is one clear weakness in the move: buying volume has been falling since the start of the month even as price has kept rising.
$66,000 (€57,900) Is Still the Test
The next major hurdle is close at hand. For more upside, Bitcoin needs to close above the 0.618 Fibonacci level at $66,086 (€57,900) on the daily chart. Onchain data points to a similar barrier. The UTXO Realized Price Distribution shows a large supply cluster around $66,898 (€58,700), representing about 2.04% of all Bitcoin.
For European crypto readers, that matters because zones like this often mark where early buyers start taking profits or try to get out at breakeven. Here, the chart and onchain data are lining up closely, which makes the area around $66,000 (€57,900) a clear decision point. A daily close above it could open the way to $67,264 (€59,000) and then $68,764 (€60,300), while losing the channel could send the price back toward $61,752 (€54,100) or lower.
The market also appears to want more proof that fresh demand is coming from spot Bitcoin ETF inflows. Without that kind of support, any bounce may look more like a technical move than the start of a broader shift in capital.
Bitcoin is still getting a lift from the same cooling inflation trend that sparked an earlier move, when the coin climbed toward $65,000 (€57,000) after softer U.S. data. So for now, this rally is still mostly a test of whether macro optimism can actually carry over into the spot market.