Bart Simpson Pattern Appears in Bitcoin and XRP
Traders see the pullback in Bitcoin, XRP, and Ethereum as a possible distribution pattern. The resistance around $81,000 for BTC is especially keeping the market on edge.
Key Takeaways
- Bitcoin, XRP, and Ethereum pulled back after strong rallies, prompting traders to bring up the Bart Simpson pattern again.
- Bitcoin rose from about $64,420 to nearly $80,700, then fell back to around $76,500.
- XRP climbed from about $1 to $1.52, then moved sideways before dropping to around $1.32.
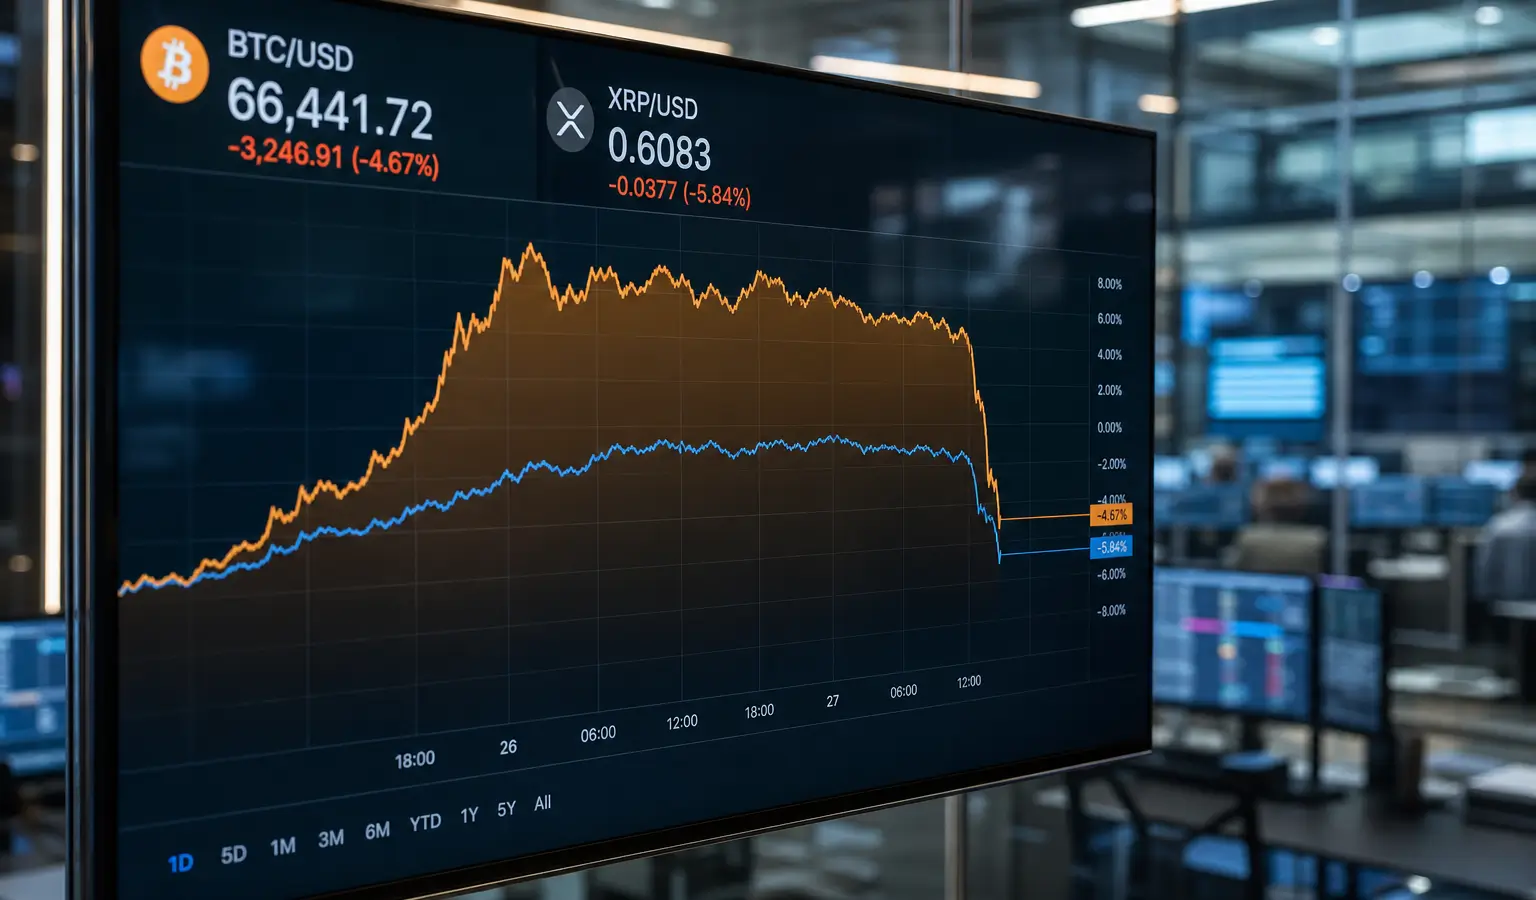
Crypto traders are once again pointing to the so-called Bart Simpson pattern as Bitcoin, XRP, and Ethereum pull back after strong gains. The shape on the chart looks like Bart Simpson’s haircut: first a sharp jump, then a flat stretch, and then a quick drop. According to traders, that can point to selling pressure from larger players, although there is no certainty that the pattern will fully play out.
Bitcoin Turns After a Fast Rally
Bitcoin started the move on August 19 around $64,420 (€55,600). Two days later, the price was already almost $14,000 (€12,100) higher, around $78,300 (€67,600), and on August 25 Bitcoin climbed to just under $80,700 (€69,600). At the time of writing, the price was around $76,500 (€66,000).
That fast rise was followed by a pullback, exactly the kind of move traders link to the Bart Simpson pattern. The pattern was first named in 2015 by former X user @whaleclubco, when BTC was still trading around $229 (€198). According to market watchers, it has been at least three years since the term came back so strongly into the conversation.
XRP Shows the Same Picture
XRP also showed a similar move. On August 19 and August 22, the price jumped from about $1 (€0.86) to $1.52 (€1.31). After that, XRP mostly moved sideways and then slipped back to around $1.32 (€1.14).
Mati Greenspan, founder of Quantum Economics and former senior analyst at eToro, said a real Bart Simpson pattern only counts if the price drops by at least 20%. He added that he does not expect that to happen now. He also noted that these patterns used to show up more often in smaller, less mature markets, while higher liquidity, deeper markets, and more institutional participation have made them less visible in Bitcoin.
Why Traders Are Watching This
Frank Hepworth, CEO and founder of New Market Trading, sees the current shape as a warning instead. He calls it a classic distribution pattern, where large holders sell while retail buyers are still getting in. According to him, Bitcoin has run into resistance several times around the 50-week moving average at $81,000 (€69,900), which he sees as an important level for the bears.
For European crypto followers, this matters especially because patterns like this often get a lot of attention when the market is already moving fast. It does not automatically say anything about the next price move, but it does show how traders try to read whether a recent rally will keep going or start to cool off. For XRP, another factor is that the coin is underperforming Bitcoin, according to Hepworth, which adds to the debate about relative strength.
Bitcoin is also running into a broader resistance zone around $80,000 (€69,000) to $82,000 (€70,800), where market data shows a lot of supply and the 50-week line is close by.