Bitcoin Bear Market Clashes With On-Chain Data and $35,000 Target
Historical cycles still point to one more drop, but on-chain signals like record long-term holder supply and low exchange reserves suggest a bottom may already be forming.
Key Takeaways
- Bitcoin is trading around $64,000 (€55,800), which still leaves it well below the October 2025 all-time high.
- Analyst CryptoCon sees room for a drop to $46,000 and later $35,000 based on historical bear markets.
- On-chain data shows record shares held by long-term holders and low exchange reserves, which could point to a bottom forming.
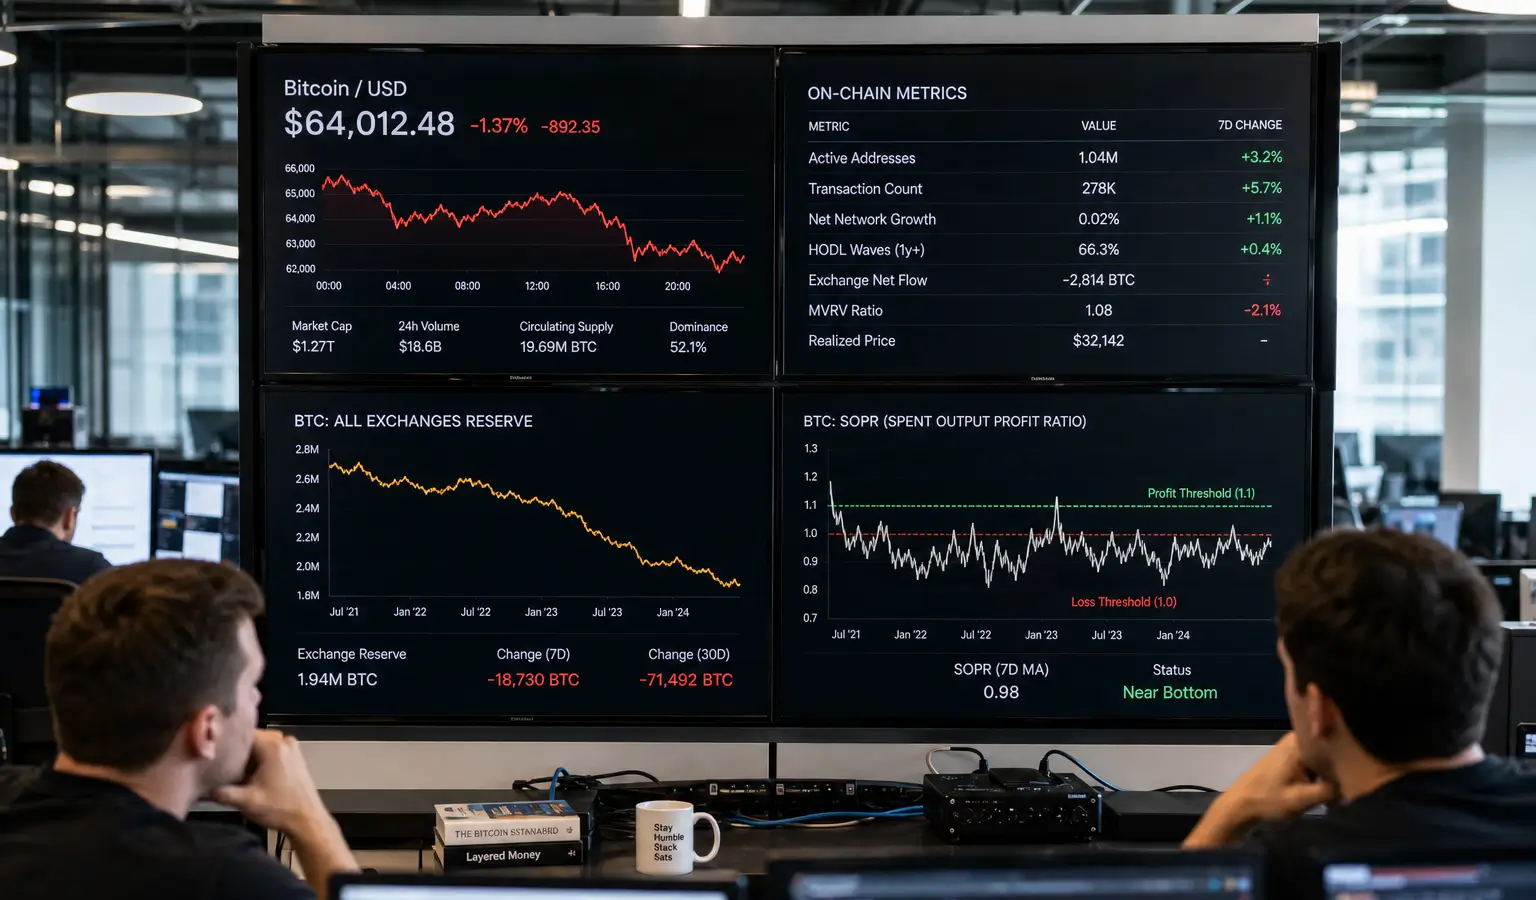
Bitcoin is hovering near $64,000 (€55,800), still far below its October 2025 all-time high. Even with that gap, historical bear market patterns suggest the current move may not be over yet, while on-chain data is already flashing signs that a bottom could be close. For Bitcoin investors, the key question over the next few months is whether seasonal cycle patterns or long-term holder behavior turns out to be the better guide.
Historical Patterns Point Lower
Analyst CryptoCon compares the current cycle with the bear markets of 2014, 2018, and 2022. In those downturns, the first leg lower often arrived in August and September, followed by a sharper second drop later in the year. Using that pattern, he expects Bitcoin to slide toward about $46,000 (€40,100) in 2026, with a deeper move to $35,000 (€30,500) in early 2027 still on the table.
That lower range matches earlier calls that put the bottom somewhere between $44,000 (€38,300) and $47,000 (€41,000). Benjamin Cowen has also recently pointed to a similar zone. CryptoCon says that outlook runs against the current bullish divergence and against long-term indicators that already appear to be signaling cycle lows.
The current bear market has now lasted about 233 days, making it the fourth longest since 2014. Even so, the 51.2 percent maximum drawdown is still relatively shallow compared with earlier cycles, when Bitcoin often lost 70 to 85 percent.
On-Chain Data Points to a Bottom
At the same time, several on-chain metrics are already close to levels that have marked past turning points. The ratio between short-term holder and long-term holder cost basis has not fully compressed to one yet, something that has historically tended to happen only near major cycle lows. Still, the ratio is falling quickly, and the long-term holder cost basis sits around $40,000 (€34,900), a level that has often acted like a magnet in previous cycles.
Long-term holders are also sitting on a record share of the supply. They currently control 74.3 percent of all Bitcoin, which suggests much of the distribution may already be behind the market. Exchange reserves have also dropped to 2.21 million BTC, the lowest level in 7 to 9 years, pointing to less Bitcoin available for immediate selling.
Glassnode's Long-Term Holder Market Inflation Rate is still negative as well, meaning long-term investors are absorbing more coins than miners are creating. Fidelity had already highlighted the strength of this group, while the MVRV Z-Score at 2.4 remains below the range that has often lined up with cycle tops.
Why This Matters
For European crypto readers, the main takeaway is that Bitcoin may already be close to a bottom by several measures, even if the chart still leaves room for one more drop. That makes the next few weeks especially important for BTC sentiment, as price action around the long-term average keeps the debate between cycle analysis and on-chain data alive. The result could also shape how investors think about liquidity, risk, and timing through the rest of 2026.
The recent on-chain analysis from Fidelity points in the same direction: the asset manager says Bitcoin's long-term holder supply is at a record, and several indicators are approaching levels that have previously been associated with bottoms.