Bitcoin June Candle Signals Heavy Selling Pressure
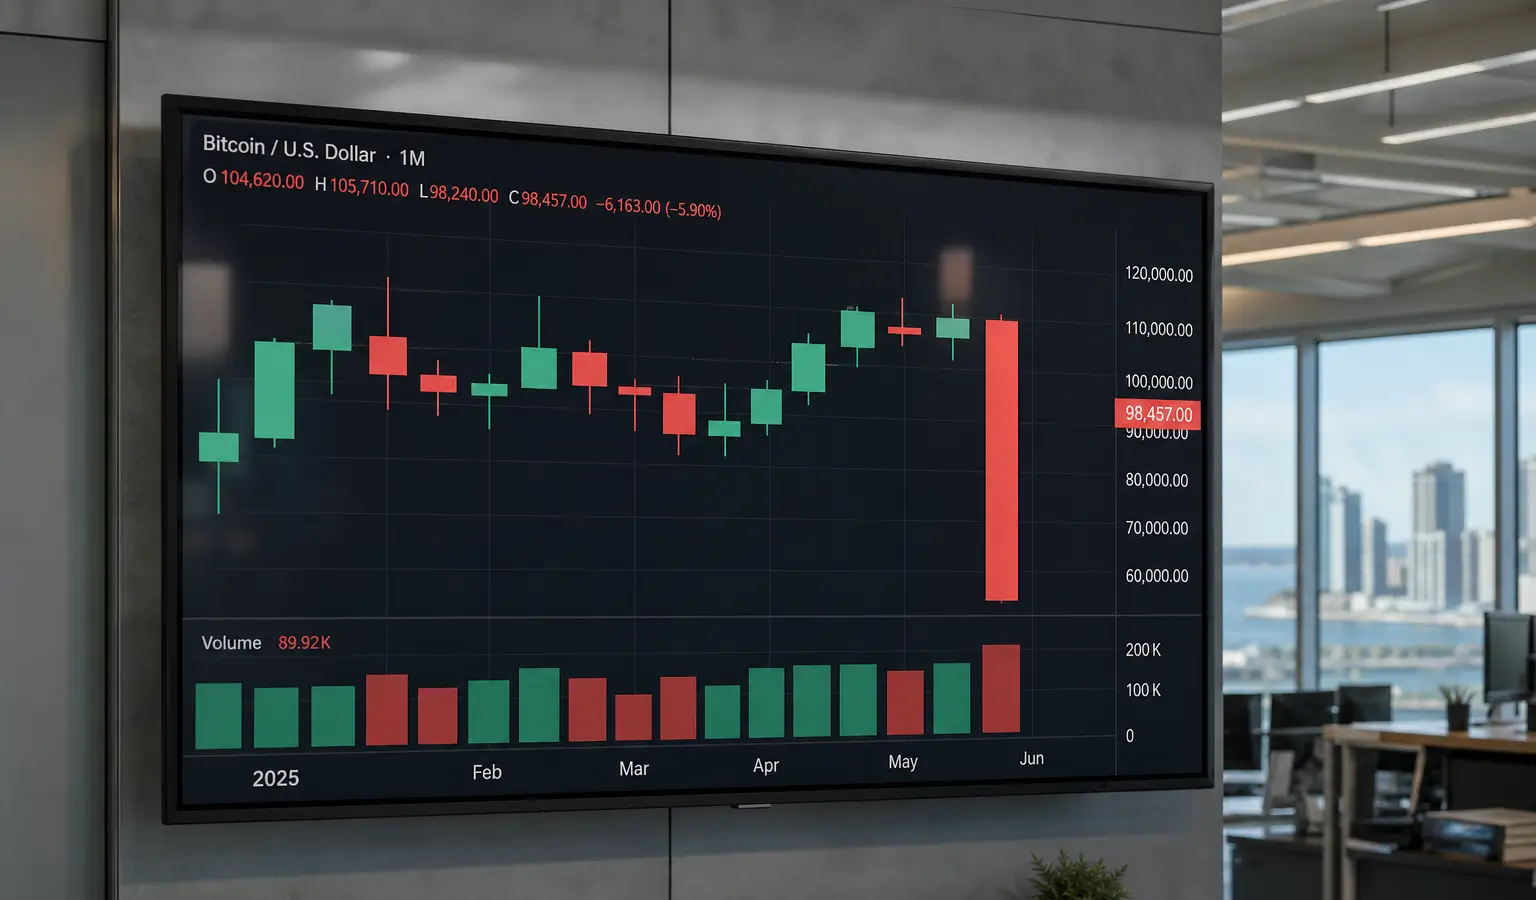
Bitcoin’s monthly chart shows a near-perfect bearish Marubozu after a 20% June drop to below $60,000. Technical analysts say the pattern points to persistent selling pressure and weak sentiment.
Key Takeaways
- Bitcoin fell 20% in June to below $60,000, marking its weakest monthly performance since June 2022.
- The monthly candle now looks like a near-perfect Marubozu, a pattern that suggests sellers stayed in control and momentum remained to the downside.
- At the time of writing, Bitcoin was trading around $58,600, while analysts are watching $48,000 to $55,000 as a possible bottom.
Bitcoin dropped 20% in June and slipped below $60,000 (€52,700), making it the weakest monthly close since June 2022. The chart looks even more troubling because the monthly candle is close to a textbook Marubozu: a large red candle with almost no visible wicks, which usually signals that selling pressure dominated the entire month.
What the Candle Shows
A candlestick captures four key price points for a given period: the open, the close, the high, and the low. The body shows the distance between the open and close, while the wicks show how far price moved above and below that range during the period.
In June, Bitcoin showed very little of that usual push and pull. It opened on June 1, slid almost continuously, and finished June 30 at the month’s low. That kind of action makes the candle stand out as especially weak, since there was almost no meaningful bounce or rejection of lower prices.
Why This Looks Bearish
Traders use the term Marubozu for a candle with a full body and little to no shadow. In technical analysis, a bearish Marubozu is often read as a sign that downside momentum is still strong, since buyers failed to stage a real recovery.
June also tends to be a soft month for Bitcoin on average, with slightly negative returns historically. That seasonal weakness adds another layer to the current move lower. Put together, the steep drop and the lack of wicks make the monthly chart look especially bearish.
What This Means for the Market
For European crypto readers, the monthly chart matters because it often gives a clearer read on the broader trend than a single day’s move. A candle like this can be a sign that sentiment across the crypto market is still fragile, especially if price keeps hovering near key support levels.
At the time of writing, Bitcoin was trading around $58,600 (€51,400). Analysts who were already looking for a deeper pullback are watching the $48,000 (€42,100) to $55,000 (€48,300) range as a possible bottom, although that still depends on how the market behaves in the coming weeks. That fits into the broader discussion about a potential move lower, with one analyst even pointing to a much lower target zone if the current range breaks.