Bitcoin Hits Resistance Around $80,000 to $82,000
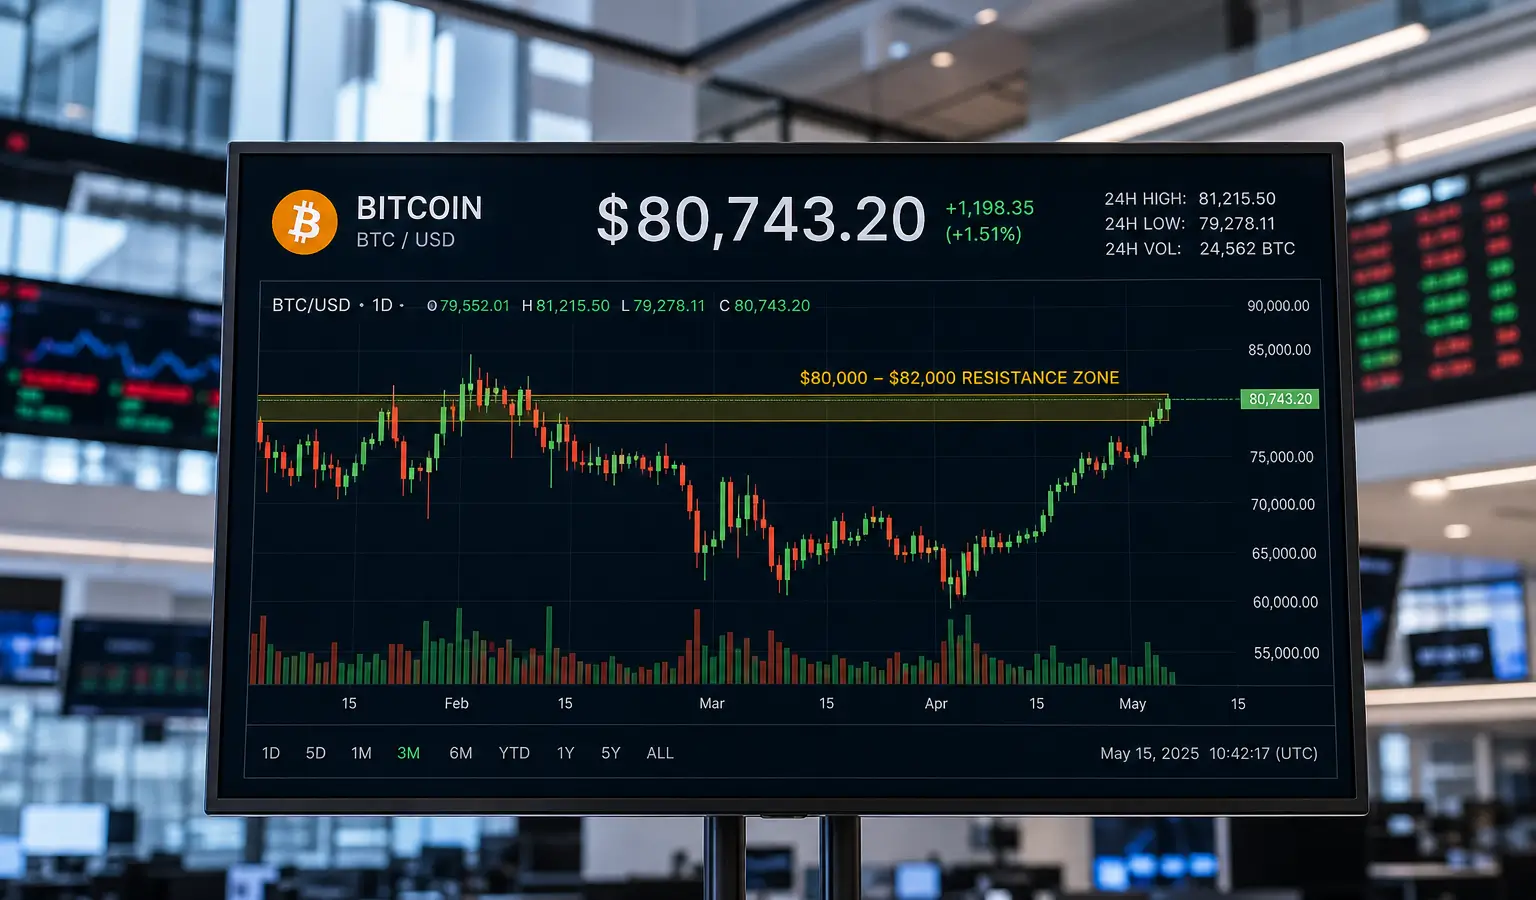
Glassnode sees a large supply zone around $80,000-$82,000, with the 50-week moving average also at $81,081. That makes this area especially sensitive to profit-taking and ETF inflows.
Key Takeaways
- Bitcoin is running into heavy resistance between $80,000 and $82,000, where nearly 8% of the supply sits, according to Glassnode.
- Around $80,000 is the biggest supply cluster; the average entry price for U.S. spot Bitcoin ETFs is also in this zone.
- The 50-week moving average is at $81,081, and Bitcoin has been trading below it since November 2025.
Bitcoin is running into heavy resistance between $80,000 (€68,600) and $82,000 (€70,300). According to Glassnode, nearly 8% of the supply sits in that band, making it the biggest supply cluster in a similar price range. That means the price is testing a zone where many earlier buyers may want to sell again once Bitcoin returns to their entry level.
Large Supply Around $80,000 (€68,600)
Glassnode’s Realized Price Distribution shows where existing coins were last moved. Around $80,000 (€68,600), about 5% of the supply sits, the biggest concentration at a single price point. At $82,000 (€70,300), the fourth-largest cluster sits, while $78,000 (€66,800) holds the second-largest concentration with about 3.7% of the supply.
That makes the zone between $80,000 (€68,600) and $82,000 (€70,300) important in the short term. Investors who bought there may be inclined to sell if price returns to their cost basis. According to Glassnode, the average cost basis for inflows into U.S. spot Bitcoin ETFs is also around $80,000 (€68,600) to $82,000 (€70,300), which makes that zone even more sensitive.
50-Week Line Still Matters
Besides the supply cluster, the market is also watching the 50-week moving average. It currently sits at $81,081 (€69,500), and Bitcoin has been below it since November 2025. The line tracks the average closing price over the past 50 weeks and is often seen by traders as an important trend gauge.
Historically, this level has played a big role more than once. In May 2020 and March 2023, moves back above this line came before longer bull markets. The zone between $80,000 (€68,600) and $82,000 (€70,300) also showed up earlier as an important level, including when Bitcoin moved above $82,000 (€70,300) in November 2024 and set a new all-time high.
Why This Matters for Europe
For European crypto investors, this matters because Bitcoin often acts as a reference point for the broader crypto market. If a large share of the supply and a closely watched trend line sit near each other, that can make trading around BTC especially sensitive. That also applies to people holding Bitcoin through a crypto exchange or an investment product, since levels like these often draw a lot of attention in the market.