Bitcoin Prints a Golden Cross, But Bear Market Uncertainty Remains
The daily chart shows a technical rebound, but on the weekly chart Bitcoin is still below the 50-week moving average. Hawkish Fed signals and strong jobs data keep the risk of more downside in place.
Key Takeaways
- Bitcoin printed a golden cross on the daily chart, but analysts do not yet see that as proof that the bear market is over.
- Hawkish signals from the Federal Reserve and strong jobs data put risky assets under pressure in September.
- Bitcoin is above the 200-week moving average, but still below the 50-week moving average, which BloFin says calls for more confirmation.
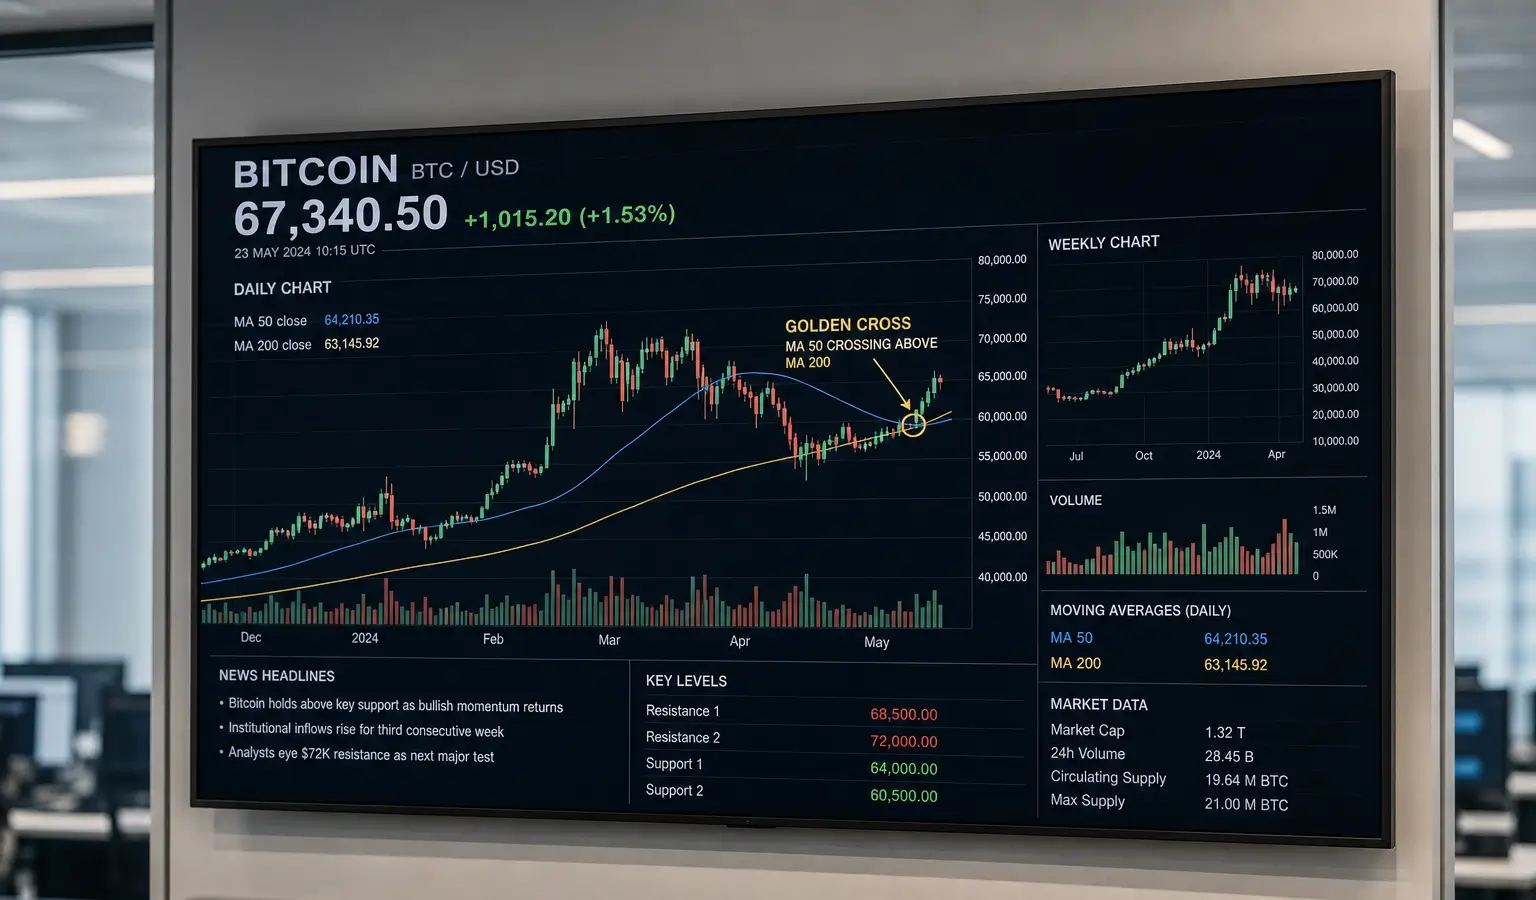
Bitcoin printed a golden cross on the daily chart, a technical signal that is often seen as positive, but analysts warn that this is still not hard confirmation that the bear market is over. The price once again saw swings in September, while hawkish signals from the Federal Reserve and strong jobs data put risky assets under pressure.
Signal on the Chart
A golden cross happens when a shorter moving average moves above a longer one. Traders often see that as a sign that momentum is improving. For Bitcoin, this is the first time since November 2025 that such a crossover has appeared, after the death cross back then.
BloFin points out that earlier golden crosses did not always lead to the same result. Since 2012, there have been twelve such signals, but only three led to a lasting rally that held up for a year or longer. The most recent golden cross in May 2025 did come before a strong move higher, with Bitcoin gaining more than 60% over the course of a year.
Weekly Chart Calls for More Proof
According to BloFin, the more important test is on the weekly chart. The desk mainly looks at the 200-week moving average as a zone where long-term bottoms often form, while the 50-week moving average carries more weight as confirmation of a new trend. Bitcoin is now above the 200-week average, but still below the 50-week average.
That difference matters. In earlier cycles, Bitcoin often stayed above the 200-week average, while deep drops tended to form around that level. In 2022, the market broke away from that pattern, partly as major deleveraging events kept playing out and the collapse of FTX added extra pressure. Bitcoin later recovered and reclaimed the level.
The comparison with other markets also shows this is not an automatic bullish signal. BloFin notes that the 200-week moving average of the S&P 500 flattened or fell during weaker periods, while gold showed a similar pattern after its 2011 peak.
Why This Matters for Investors
For European crypto investors, the key point is that a golden cross on the daily chart often sparks quick optimism, while the weekly chart still gives no confirmation. That makes the signal useful as a read on market sentiment, but not yet as conclusive proof of a structural turnaround. Anyone following Bitcoin is therefore looking not just at the short term, but also at whether the price can reclaim and hold the 50-week moving average.