Bitcoin Nears $58,000 Support in Timmer Model
Timmer’s power-law model puts Bitcoin close to a support zone that has lined up with major bottoms in 2018 and 2022. The Fidelity executive still sees no clear catalyst for a rebound.
Key Takeaways
- Bitcoin is approaching the $58,000 support level in Fidelity executive Jurrien Timmer’s power-law model.
- The price is trading around $62,700, while its deviation from the trendline sits at minus 56%, a range Timmer describes as an accumulation area.
- Timmer still does not see a clear bottom, saying the speculative premium has faded and that any rebound likely depends on better liquidity.
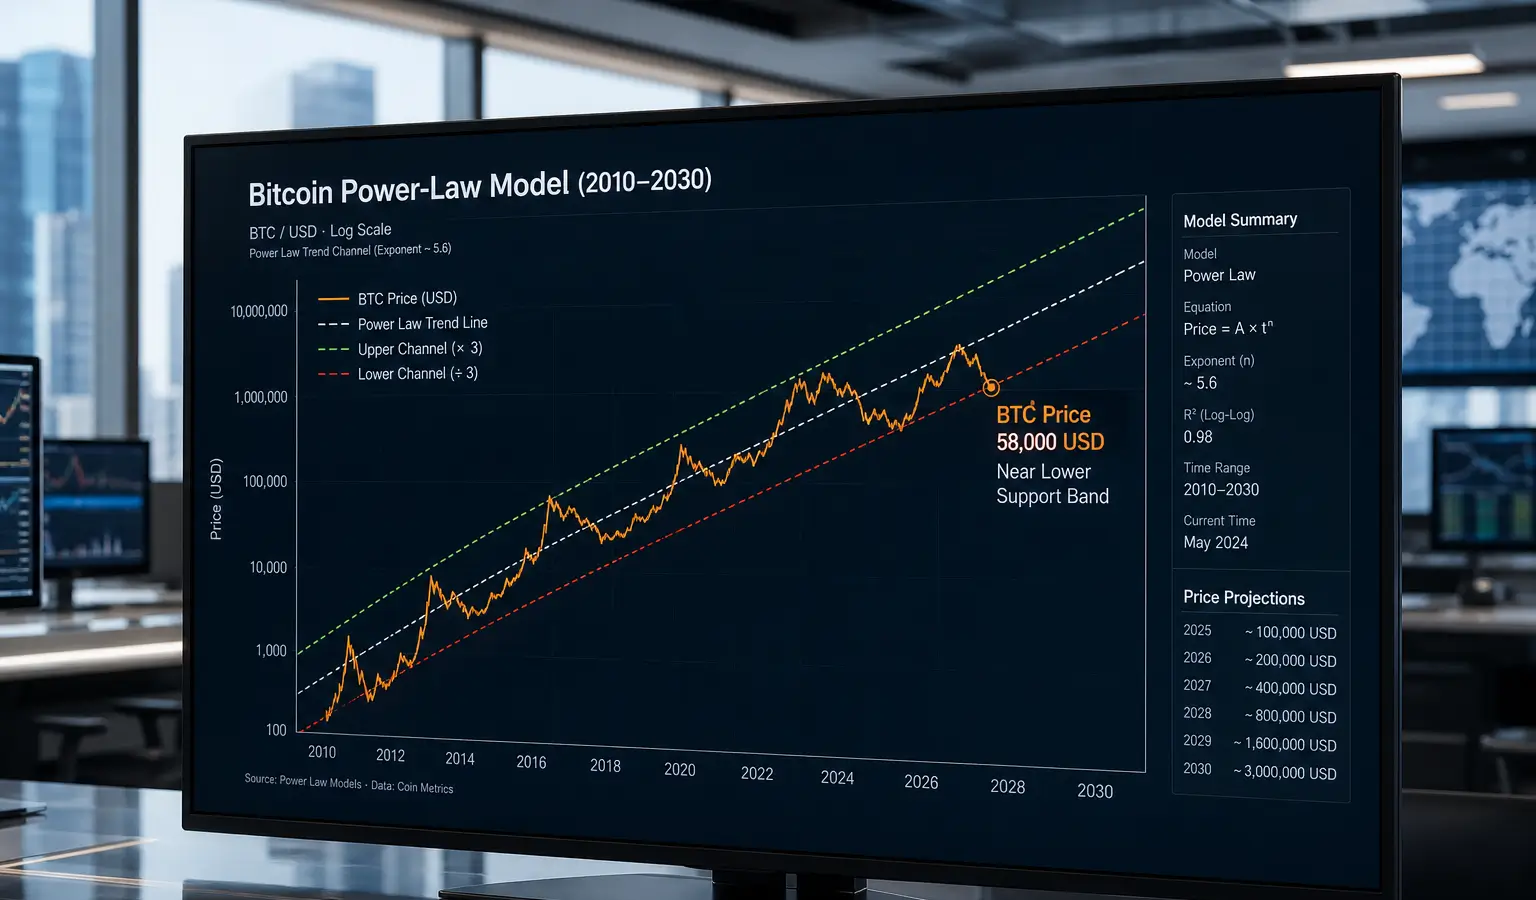
Bitcoin is drifting toward the lower end of a model that Fidelity executive Jurrien Timmer has followed for years to map the asset’s price action. In his power-law chart, support now sits near $58,000 (€50,700), while Bitcoin is changing hands around $62,700 (€54,900) and edging closer to that level.
Support Around $58,000 (€50,700)
Timmer’s model places Bitcoin’s entire price history on a logarithmic chart with three key lines: an upper resistance band, a middle line and a lower support line. He says that lower line has marked every major bottom since 2015. Bitcoin is still above it for now, but the distance between the two is narrowing.
In the model’s lower panel, Timmer tracks Bitcoin’s deviation from the trendline. That reading is currently minus 56%, which he calls an accumulation zone. Similar levels in the past lined up with the 2018 and 2022 bottoms.
No Clear Catalyst
Timmer is not ready to call this a bottom yet. He does say the speculative premium that helped push Bitcoin above $120,000 (€105,000) last year has largely faded. He also notes that global money supply growth is slowing, and says there is still no obvious catalyst for a rebound unless liquidity improves.
He adds that Bitcoin can stay pinned near a support level like this for months before the trend finally turns. That fits the broader market backdrop as well, with fast money already moving out of Bitcoin into gold, and then out of gold into semiconductors, where the momentum trade is now.
Why This Matters
For European crypto readers, the point here is that model-based levels like this are often used to frame where Bitcoin sits in the cycle. Timmer’s reference to the 2018 and 2022 lows shows that he is looking at Bitcoin as more than a simple price chart. He sees it as an asset that moves in recurring cycles shaped by liquidity and risk appetite. That does not mean a bottom is in, but it does help put the current weakness into context.
Other analysts are watching similar levels too: Bitcoin Holds Support as Consolidation Nears Record previously pointed to a broad support band between $58,000 (€50,700) and $64,000 (€56,000).
The broader debate over the cycle is still open, with some market watchers warning that this phase may not necessarily be the final leg of the decline.