Bitcoin Holds Support as Consolidation Nears a Record
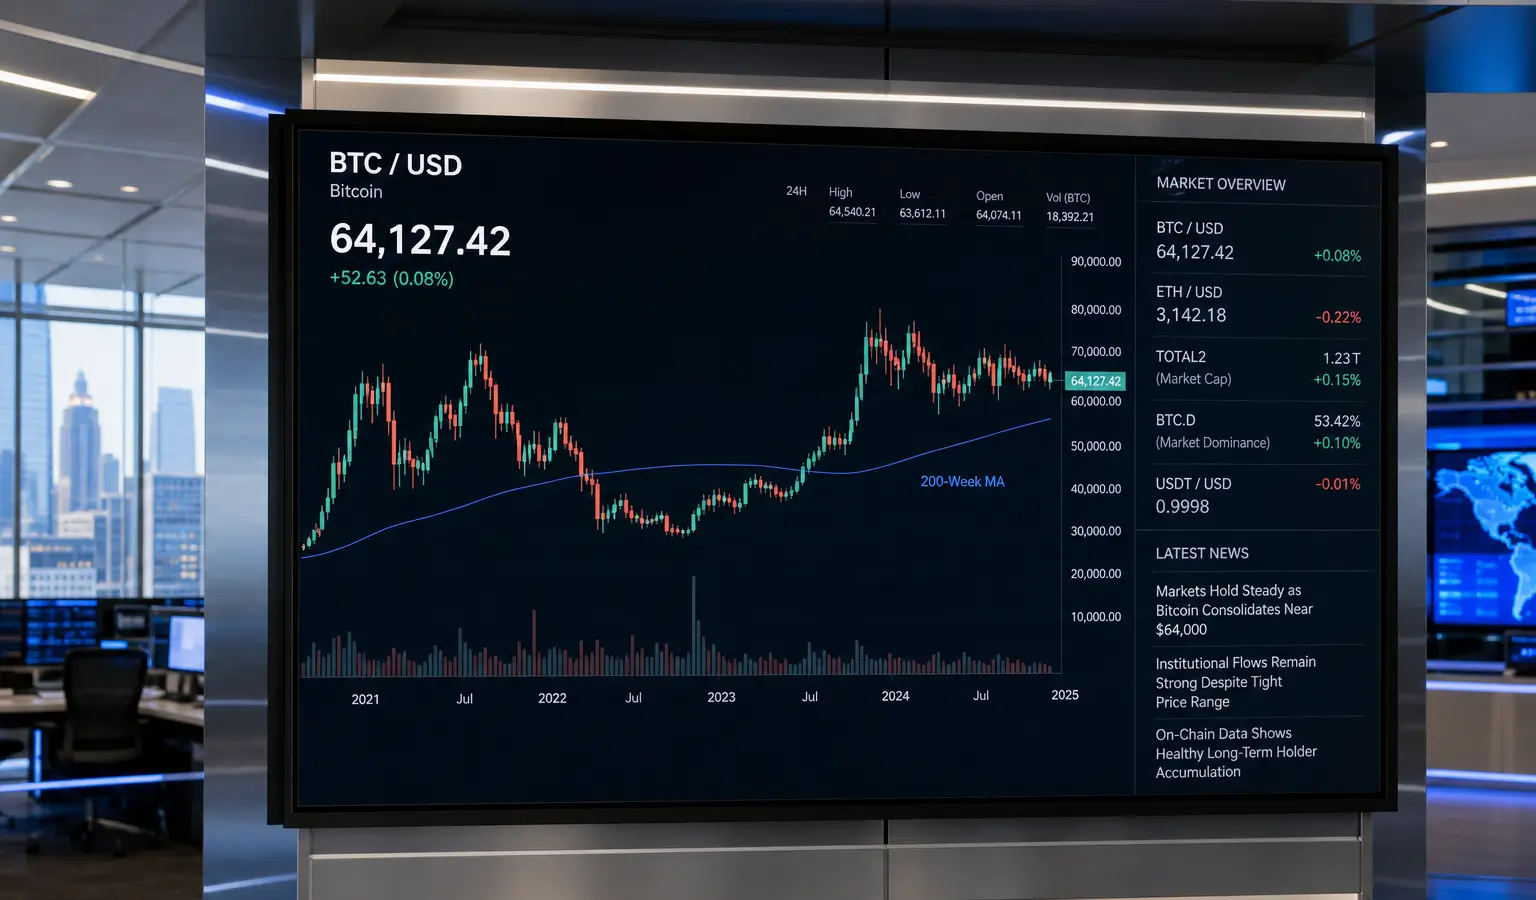
Bitcoin has been stuck near $64,000 for months, with the 200-week moving average and a dense cost basis zone acting as important support levels.
Key Takeaways
- Bitcoin is trading around $64,000 and has been moving between $60,000 and $70,000 for 307 days.
- The current sideways stretch is Bitcoin’s third-longest $10,000 range in history.
- The 200-week moving average is around $62,873, and about 6% of supply sits between $58,000 and $64,000.
Bitcoin is hovering around $64,000 (€56,000), which means it has now spent 307 straight days trading inside the $60,000 (€52,500) to $70,000 (€61,200) band. That puts the asset in one of its longest consolidation phases on record, with traders and analysts focused on whether it can keep holding above support.
Longest Sideways Stretch
According to Glassnode, Bitcoin is now in its third-longest stretch of trading within a $10,000 (€8,750) range. Only the $10,000 (€8,750) to $20,000 (€17,500) range and the $20,000 (€17,500) to $30,000 (€26,200) range lasted longer, and both came during the 2018 and 2022 bear markets. The current setup shows just how tightly the market has been boxed in for months.
Even with that calm price action, Bitcoin is still about 50% below its October all-time high. In other words, the market has been quiet, but it has not yet delivered a convincing breakout.
Technical Support Still in Focus
On the technical side, the 200-week moving average remains a key level to watch. It is currently near $62,873 (€55,000) and is widely used as a long-term trend marker. Moves below it have historically tended to be brief, which is why market participants are paying close attention now.
Glassnode also highlights a meaningful cost basis zone. Its Entity Adjusted UTXO Realized Price Distribution shows that about 6% of circulating supply sits between $58,000 (€50,700) and $64,000 (€56,000). That suggests a large cluster of coins last moved at those price levels.
Why This Matters
For European crypto investors, the main takeaway is that long consolidation often reveals more about market structure than any single daily move. A broad cost basis zone combined with a closely watched long-term indicator can help show where the market is most vulnerable right now. For the moment, it is still unclear whether the next major move will be higher or lower.
This sideways phase also lines up with earlier analysis from Glassnode, which pointed to weakening onchain signals and a market that has not yet confirmed a durable recovery. In that context, the on-chain cooling remains an important part of the picture.