Bitcoin Nears a Bottom Zone as On-Chain Data Cools
Glassnode sees several signs that Bitcoin may be forming a bottom, but weak ETF flows and cautious derivatives trading are still keeping a real trend reversal out of reach. The MVRV Z-Score and long-term holders also point to ongoing bear market pressure.
Key Takeaways
- Bitcoin has been trading below the True Market Mean and the Short-Term Holder Cost Basis since early February, which lines up with a late-stage bear market.
- Glassnode does see signs of a bottom, but institutional flows are still weak and derivatives markets continue to point to downside risk.
- The MVRV Z-Score is moving closer to historic bottom territory, while Bitcoin was trading around $62,904 after recent pressure on risk assets.
Bitcoin is flashing more signs of a late-stage bear market onchain, but the market has not yet confirmed a durable bottom. Glassnode says a few indicators are starting to look like a bottoming process, while others are still too soft to support a convincing trend reversal.
Late Stage of the Decline
Glassnode writes in its latest report that Bitcoin has been trading below both the True Market Mean and the Short-Term Holder Cost Basis since early February. The firm puts those levels at $76,600 (€67,200) and $72,200 (€63,300), respectively. In other words, Bitcoin has spent five months below both averages, a stretch that has only rarely lasted this long in its history.
Glassnode says that setup usually shows up when new buyers keep entering the market below the cost basis of recent buyers and the broader active market. That kind of environment often appears near cyclical bottoms, but it is still not enough on its own to prove the trend has already turned.
Long-term holders are still adding to the pressure. Their share of total realized losses climbed to 43% on a 30-day moving average, up from 15% in February. Capitulation also recently peaked at nearly $280 million (€246 million) per day, the highest level since December 2022.
Signals That Are Still Missing
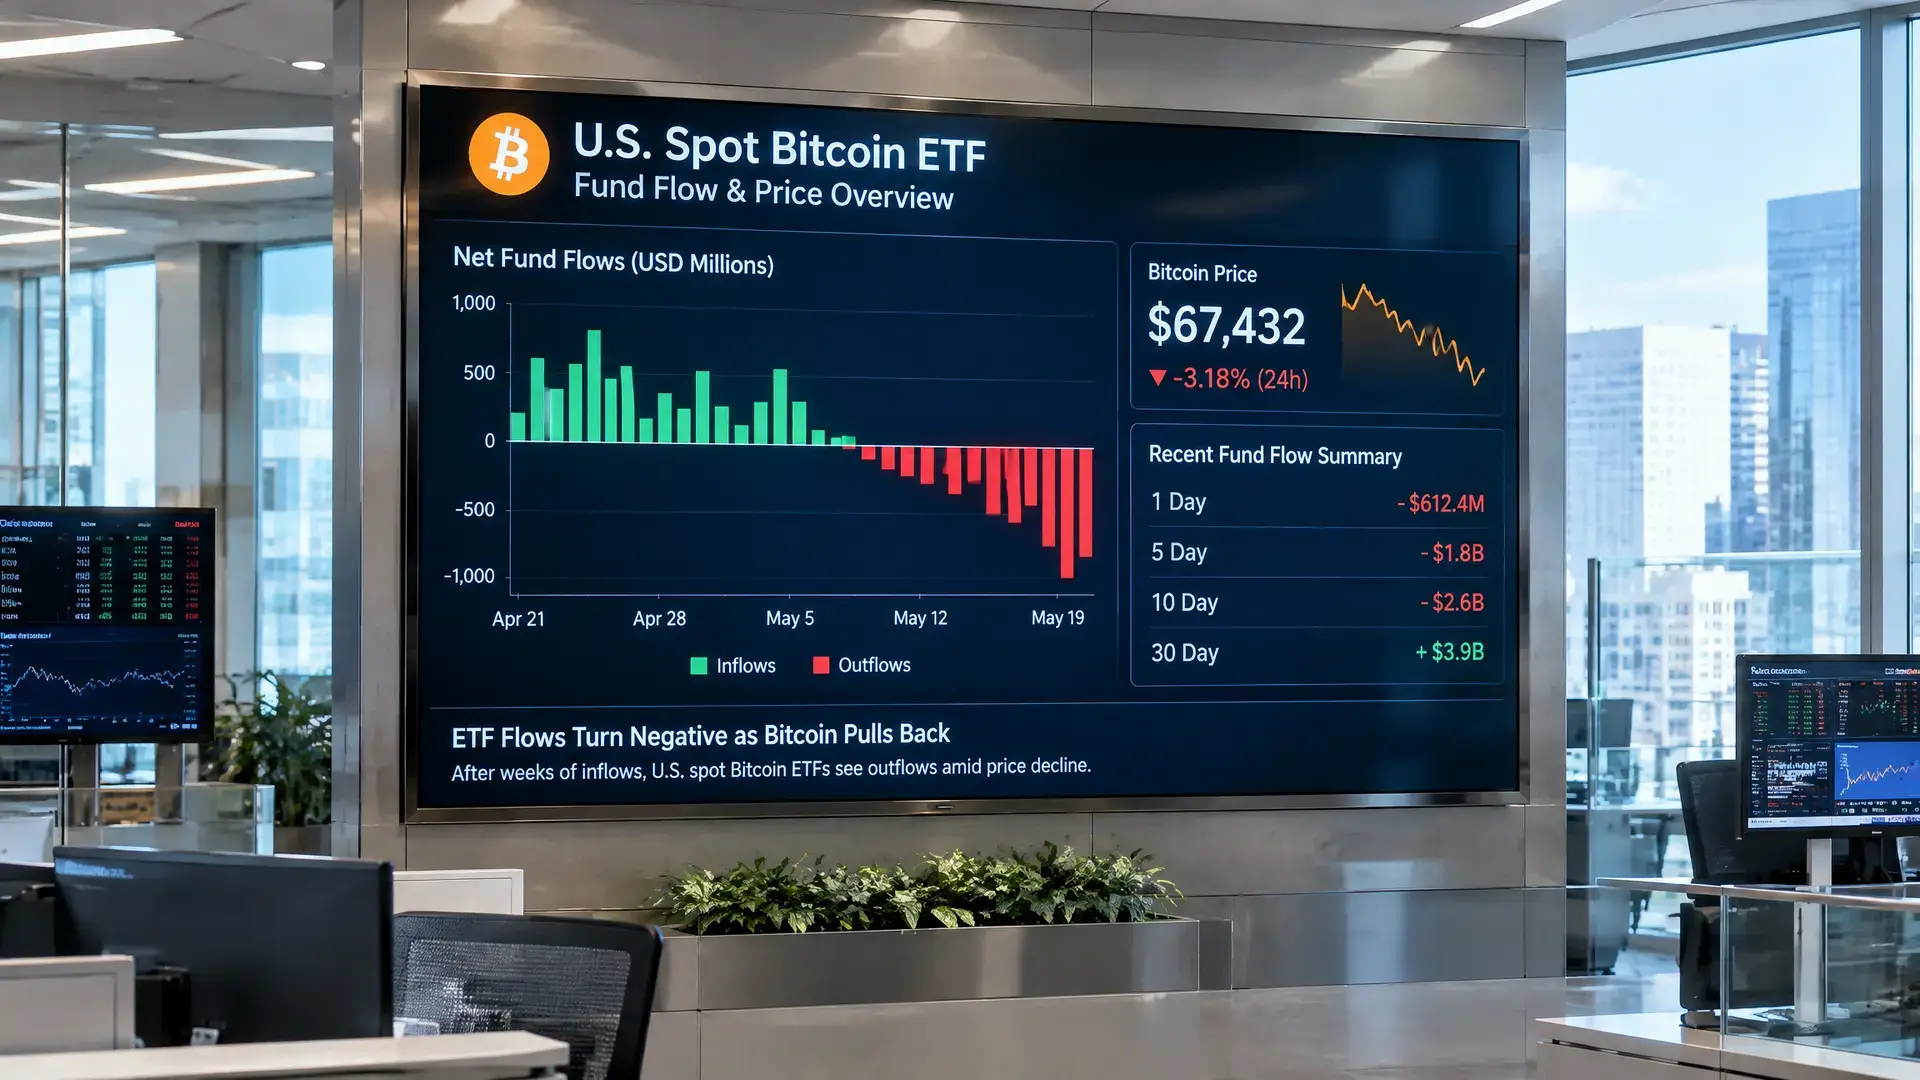
Beyond the onchain weakness, institutional demand is still not showing much strength. Spot Bitcoin ETF outflows have slowed to $88.9 million (€78 million) per day from a June high, but net flows are still negative. The derivatives market is also staying defensive, with a put/call ratio of 0.56, the lowest reading of 2026, while skew and volatility still suggest more downside risk.
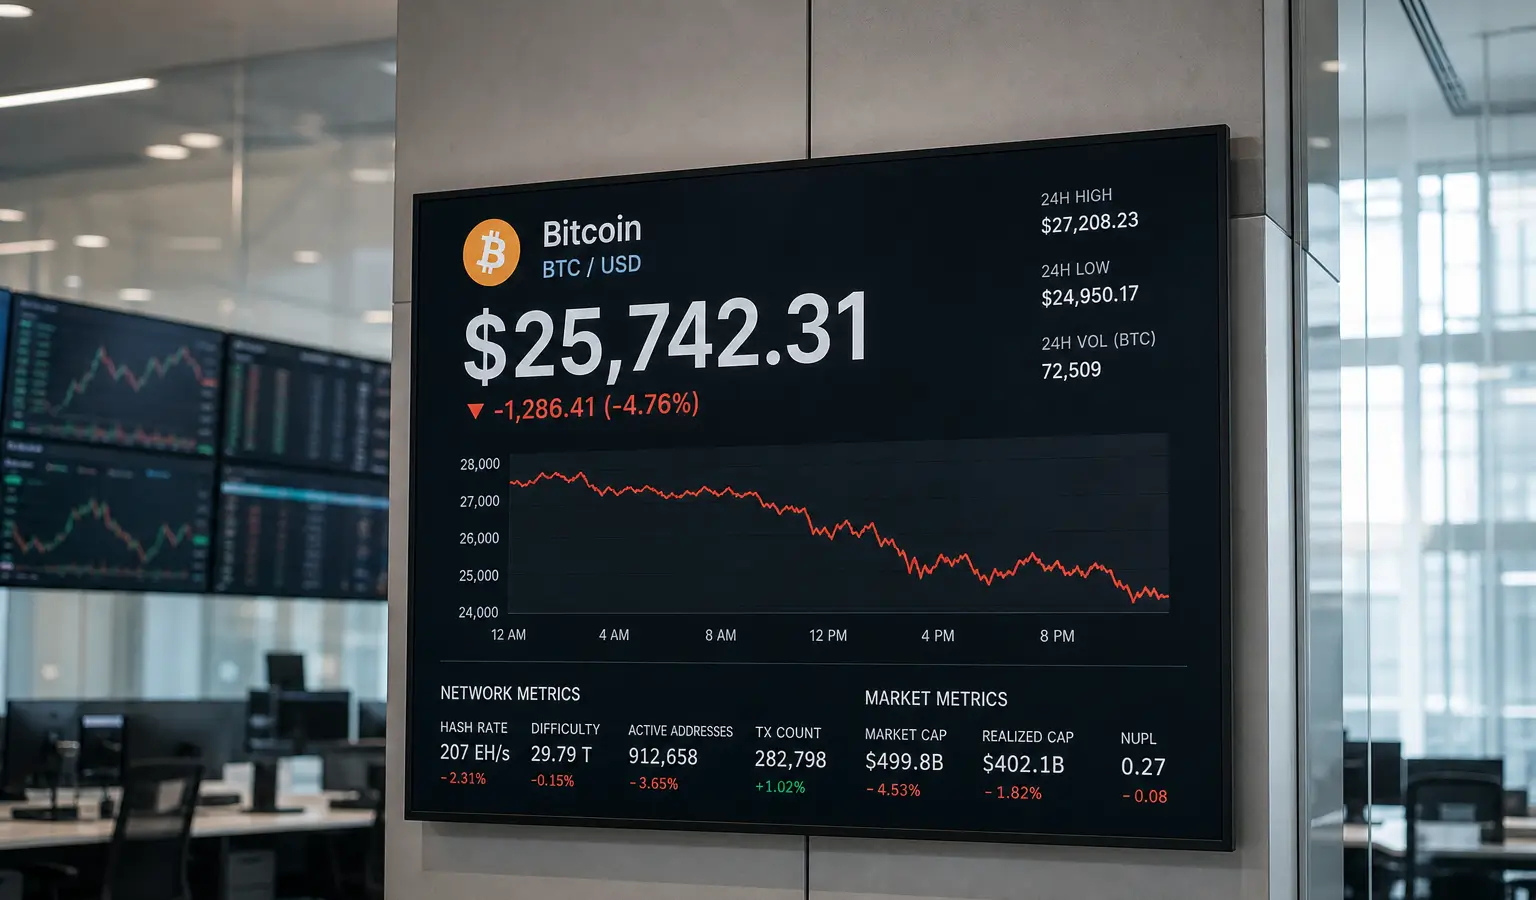
Glassnode says the market still needs more capitulation to wash out, steadier institutional flows, and ideally a sustained move back above the True Market Mean before anyone can call a regime shift convincing. Another widely watched valuation gauge, the MVRV Z-Score, has now dropped to around 0.27 and is edging toward historic bottom zones, which may point to lower valuation levels.
Why July Still Matters
For European crypto readers, the main takeaway is that the current weakness fits into a larger market cycle. In past bear markets, Bitcoin fell 77% to 86%, while the current drop from the October 2025 peak is about 53%. That makes this correction less severe, but it still does not tell us exactly when the market will finally turn.
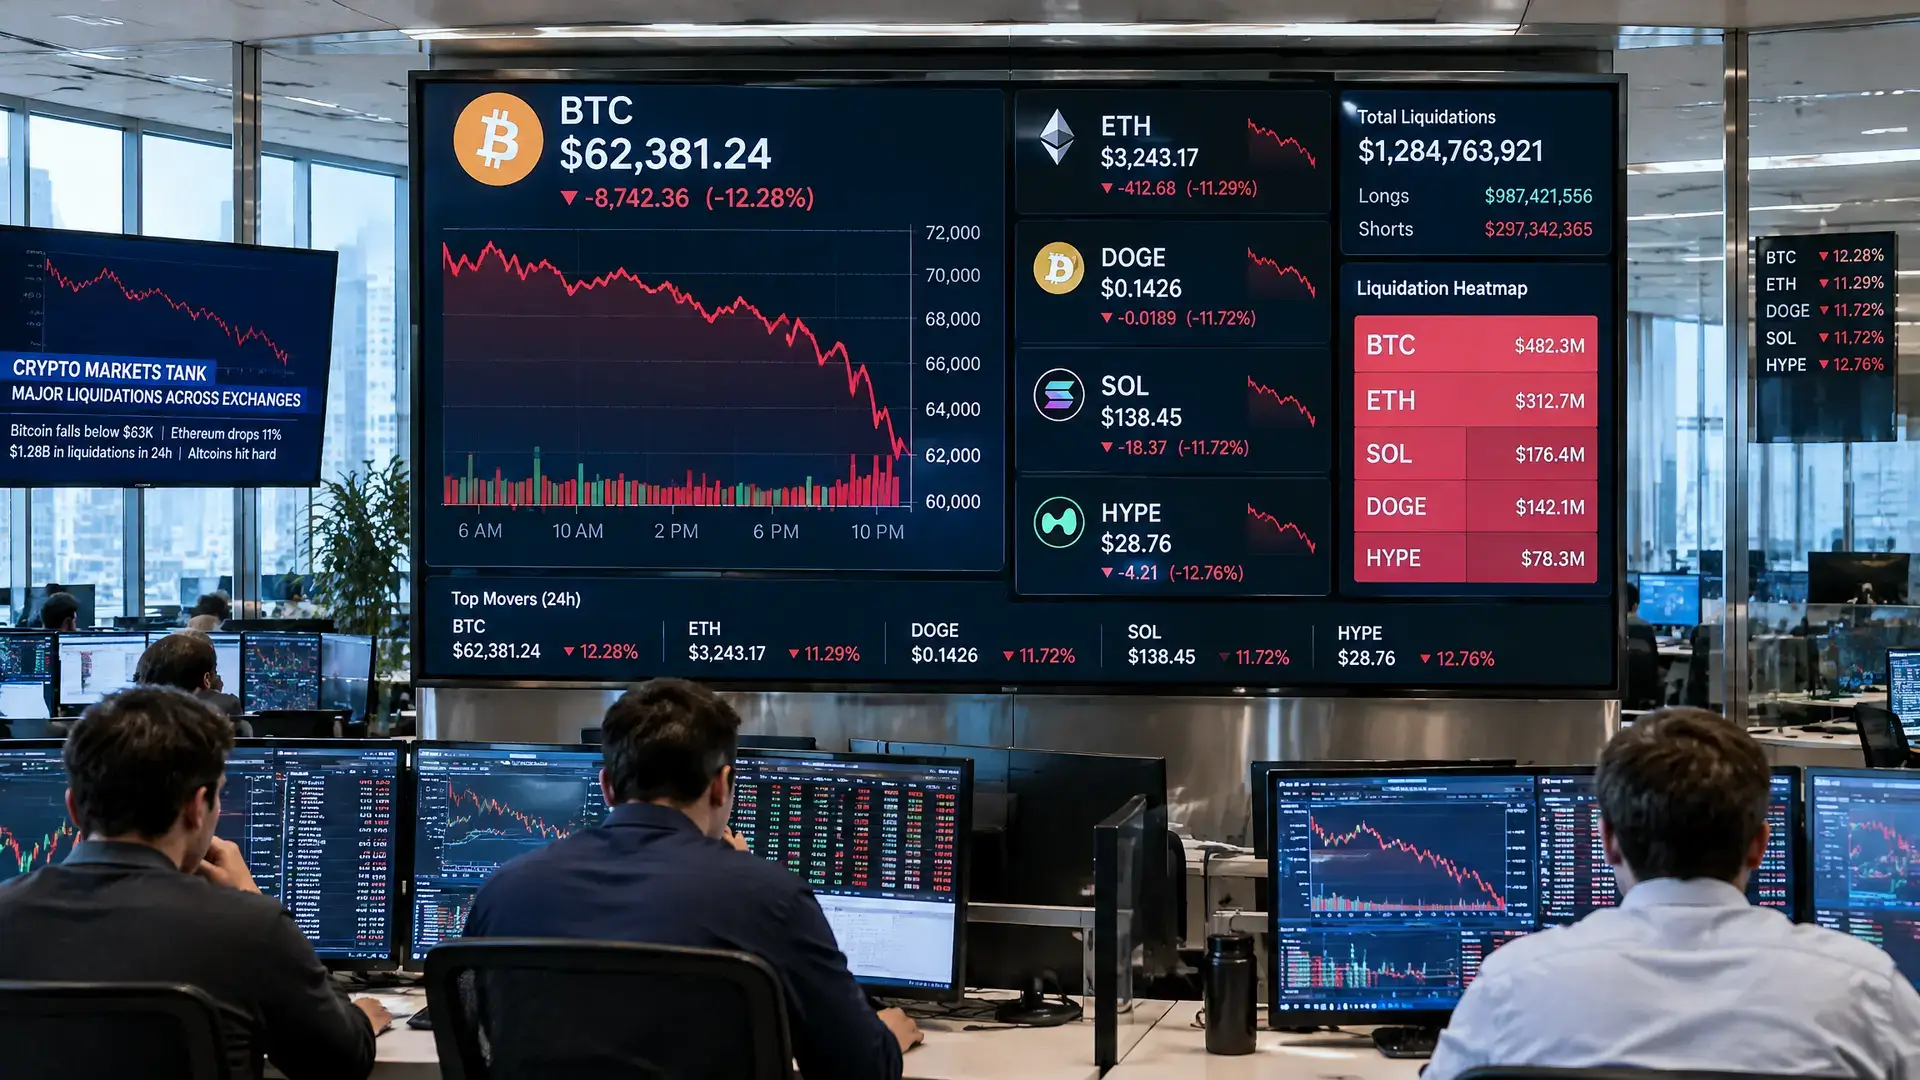
At the same time, CryptoQuant notes that July has often been a strong month for Bitcoin over the past 10 years. During the bear market years of 2018 and 2022, the price gained about 20% and 17% in July, respectively. Even so, the current setup is still mixed: the Bull Score Index sits at 20, far below the 60 level CryptoQuant says is needed for a lasting rally. At the time of writing, Bitcoin was trading near $62,904 (€55,200) after new U.S. strikes on Iran pressured risk assets and wiped out part of the rebound from the $57,700 (€50,600) low.
Weak ETF flows also fit into a broader pattern of fading institutional demand. In a recent analysis of weak ETF flows and lower open interest, it was already clear that Bitcoin's recovery is still struggling to build broad support.