Ethereum Under Pressure as Weak Activity and Whale Buying Clash
Glassnode is seeing fewer active addresses, while large holders are buying ETH. At the same time, spot Ethereum ETFs posted net outflows in June.
Key Takeaways
- Ethereum begins July 2026 near $1,570 (€1,380), close to multi-month lows, after logging its first-ever stretch of three straight red quarterly candles.
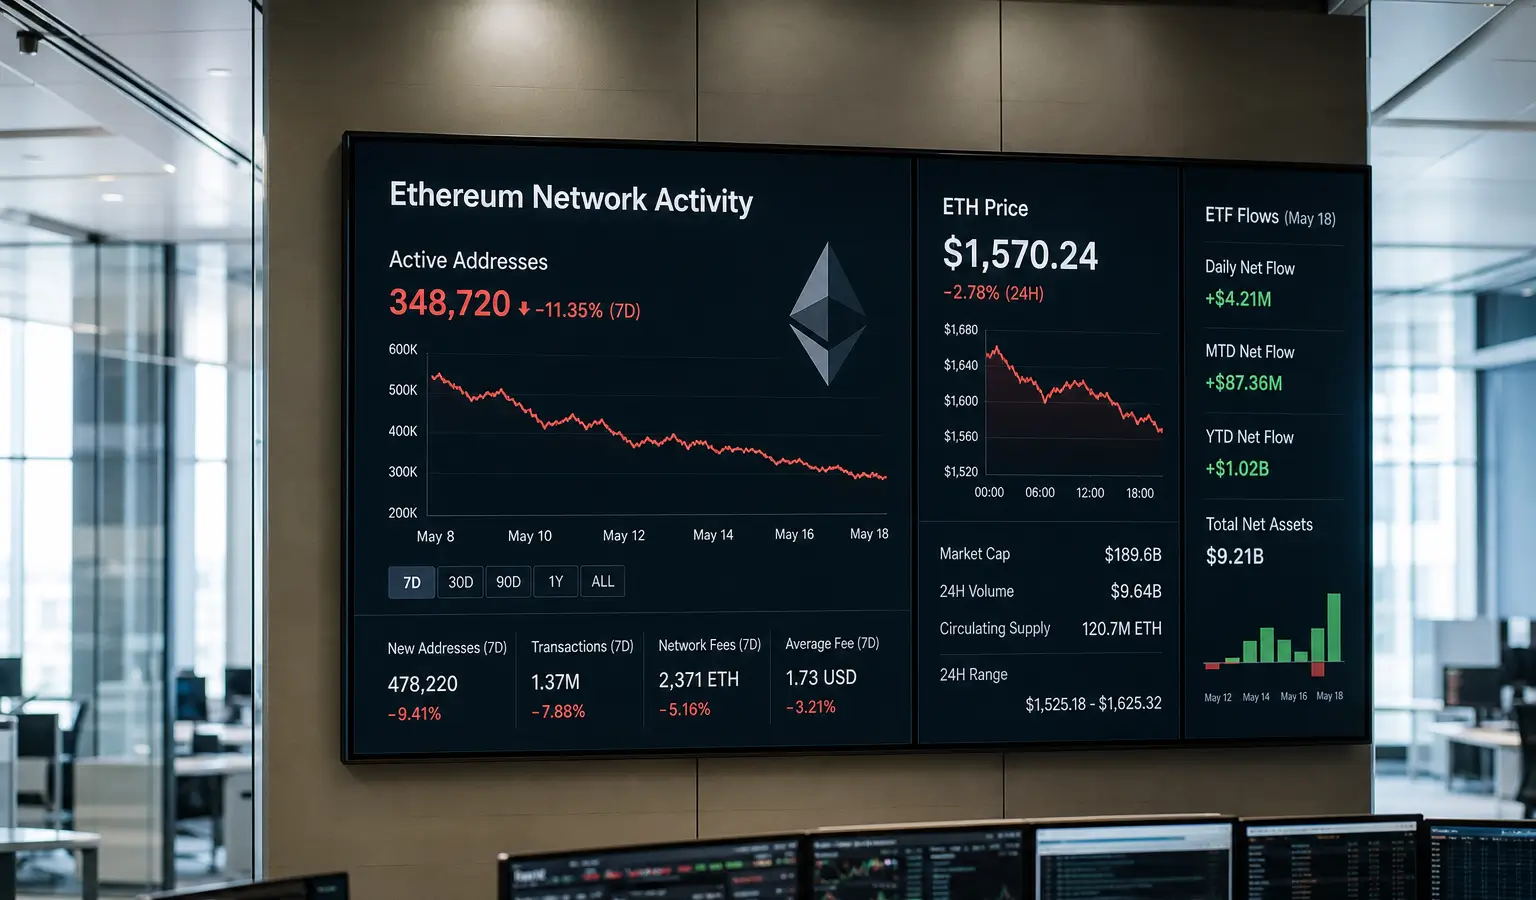
- Network activity is fading quickly, with active addresses falling from about 795,000 in early February to roughly 420,000.
- Large holders appear to be buying even as ETH stays under pressure, with $1,500 still the main support level to watch.
Ethereum (ETH) is starting July 2026 around $1,570 (€1,380), not far from its multi-month lows, after posting its first-ever run of three consecutive red quarterly candles. That leaves one of crypto’s biggest assets flashing a rare sign of weakness, even as onchain data and price action continue to point in different directions.
Network Activity Is Slipping
Glassnode data shows active addresses are still trending lower. The 14-day moving average reached a high of about 795,000 in early February, but it has since fallen to around 420,000, a drop of roughly 46 percent. That suggests network usage is cooling and interest may be fading, especially since June printed the lowest reading on the chart.
One notable detail is that the first leg lower in January came even as price was still moving up. That looks more like speculative turnover than durable demand. After that, price and activity started moving down together, and the brief rebounds in March, April, and May never really held.
Whales Are Buying Against the Trend
Even with that weak backdrop, there is another signal worth watching: large holders appear to be accumulating. Glassnode recorded a sharp late-June jump in addresses holding 1,000 to 10,000 ETH, the biggest 30-day move on the chart. That came while ETH was trading at its lowest point, which could indicate bigger players were positioning early.
That interpretation carries more weight because other flow data shows whales added tens of millions of dollars in ETH, while spot Ethereum ETFs saw net outflows in June. Bitmine chairman Tom Lee linked part of the decline to end-of-quarter behavior. Tom Lee Blames Ethereum Drop on Quarter-End Window Dressing covered that explanation in more detail earlier. Still, there is a caution flag here too: a similar spike in whale counts in late February lined up with a local top, and the price still moved lower afterward.
The broader Ethereum roadmap is also part of the picture. The 2026 plan includes upgrades such as Glamsterdam and Hegotá, with an emphasis on higher gas limits, parallel execution, native account abstraction, and interoperability. That does not change the short-term setup, but it does show the network is still advancing even while the token price remains under pressure.
Key Levels for July
Technically, ETH still looks undecided. The token has already broken through three support zones, around $2,375 (€2,080), $2,175 (€1,910), and $1,925 (€1,690), and those levels are now acting as resistance. It also slipped below a falling channel and failed twice in June to retest that broken structure.
Right now, the market is focused on the psychological $1,500 (€1,320) level. A daily close below that area would put $1,200 (€1,050) in play, followed by the swing low near $881 (€773). On the upside, $1,753 (€1,540) is the main level to watch, in part because it lines up with the 0.786 Fibonacci retracement between the $881 (€773) bottom and the $4,956 (€4,350) peak. A monthly close below that point would add more confirmation to the bearish case.
For European crypto readers, the setup matters because ETH often leads broader market sentiment, especially when ETF flows, whale activity, and network usage are all moving in different directions. The combination of weaker activity, June outflows, and possible accumulation by large holders may also hint at how institutional money and retail traders are interacting with the market right now.