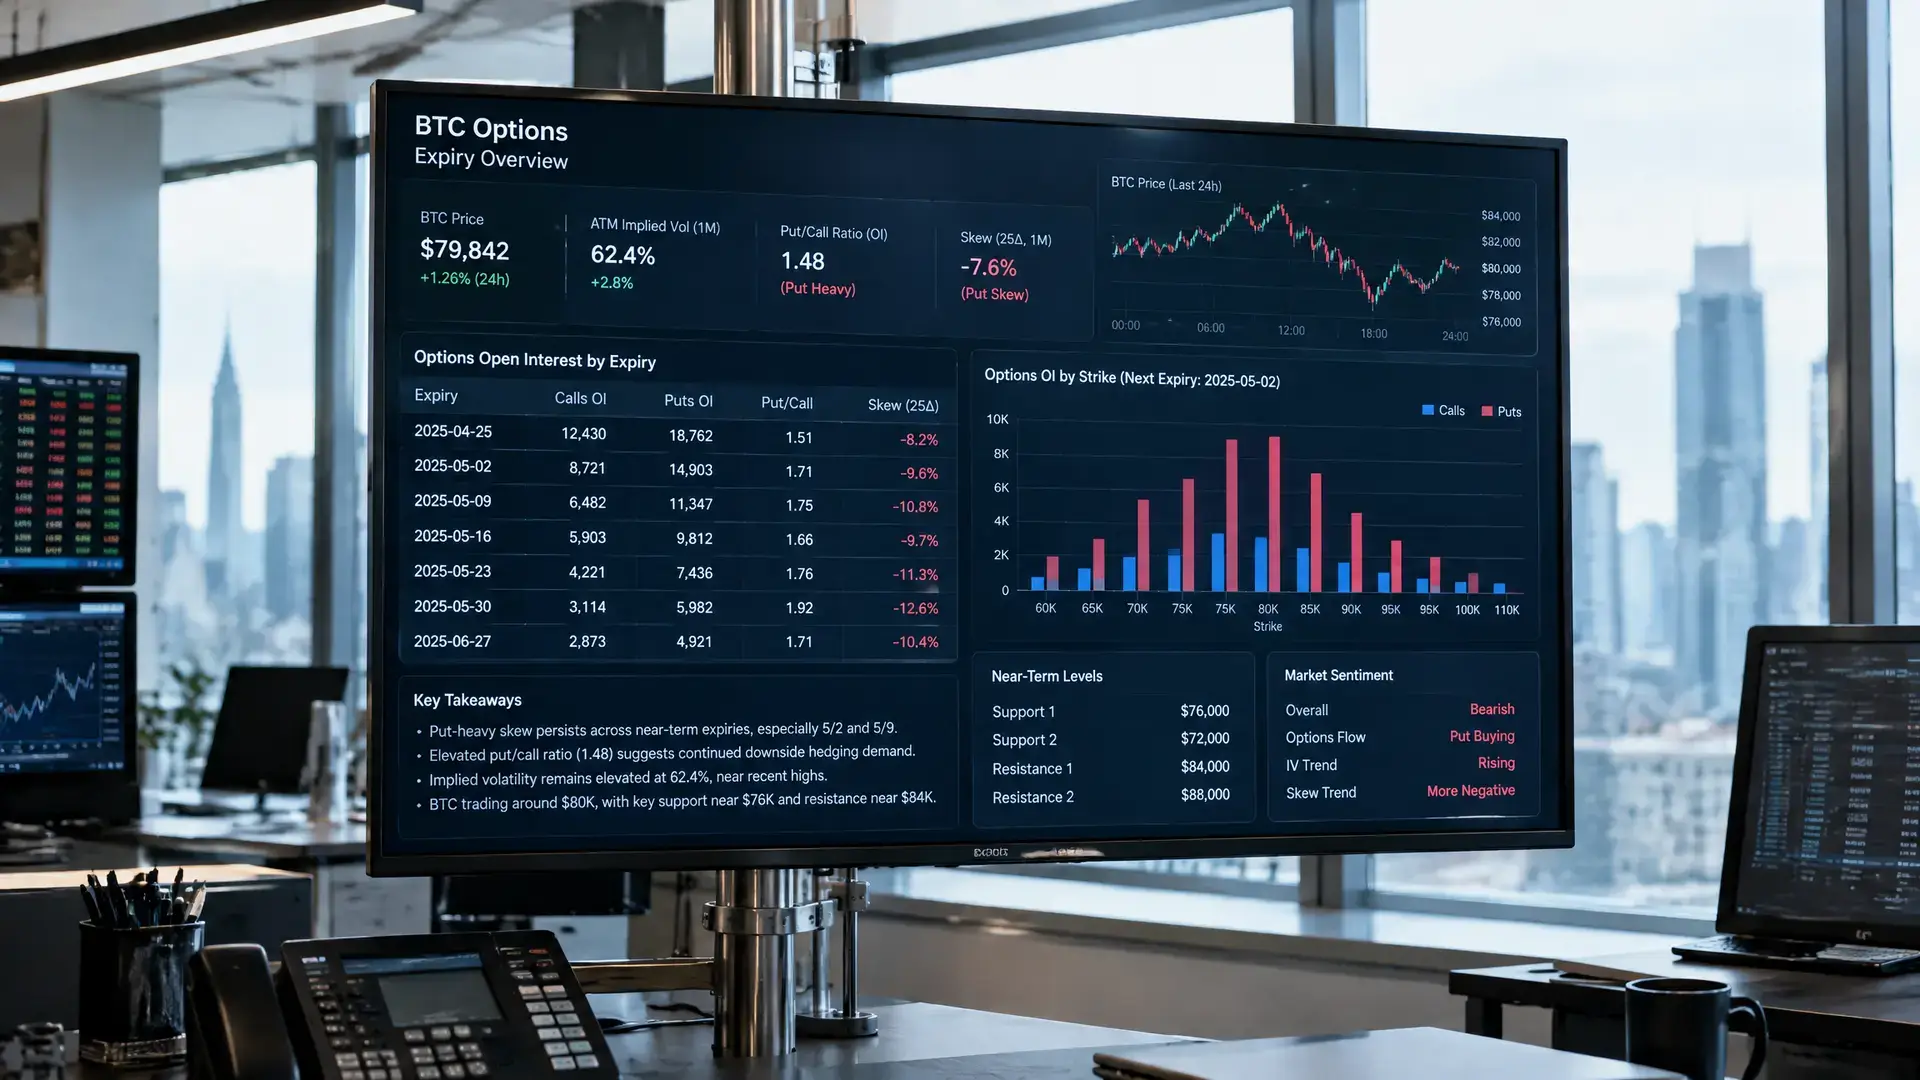

Price chart
A price chart is a graph that shows how the price of a cryptocurrency changes. You can quickly see whether the price rose, fell, or stayed about the same over a given period.
What is a price chart?
A price chart shows time on the horizontal axis and price on the vertical axis.
The chart can show a line, bars, or candlesticks. A candlestick shows details such as the opening price, closing price, highest price, and lowest price for a selected period. That period could be an hour, a day, or a month, for example.
Green and red candlesticks often show whether the price rose or fell during that period. Colors can vary from chart to chart.
An example of a price chart
You look at a price chart for a cryptocurrency over the past week. Time runs from left to right, and price runs from bottom to top.
If the line ends higher than where it started, the price rose that week. If it ends lower, the price fell. A chart makes price movements easier to see than a simple list of prices.
Why are price charts important in crypto?
Price charts often appear in reports about rising or falling cryptocurrency prices. They can show whether a move lasted only a short time or has been visible for longer.
People also use charts to look for patterns and important price levels. They may use technical indicators for this, such as a moving average. This is a calculation based on past prices.
A price chart does not predict the future. It mainly shows what has already happened to the price, and it is just one part of a broader analysis.