Bitcoin Loses Ground Against the S&P 500 and Nasdaq
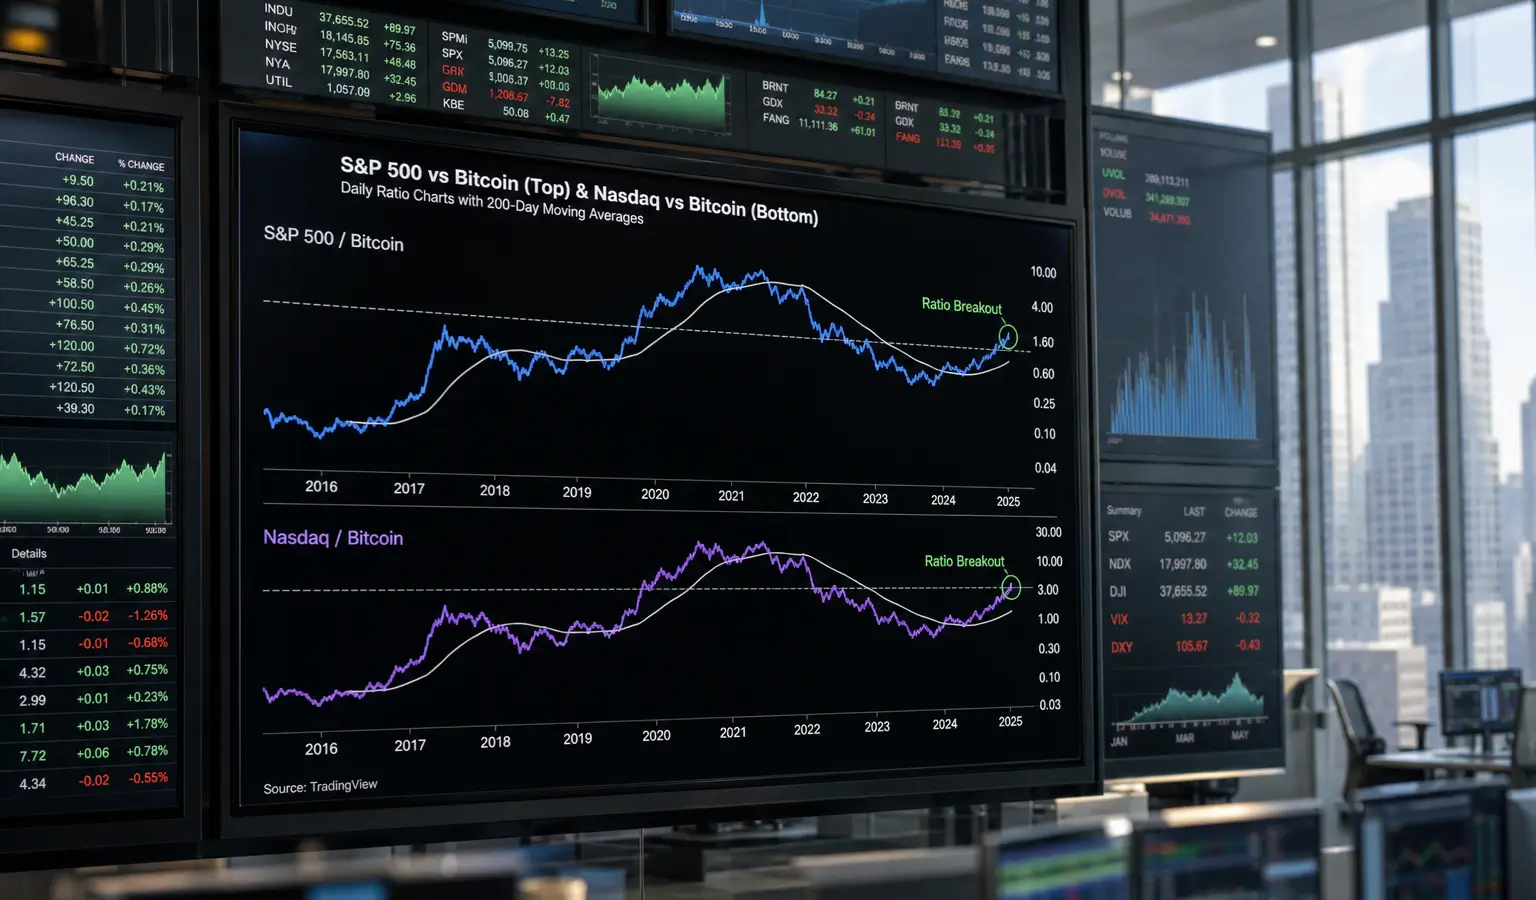
The S&P 500 and Nasdaq ratios have broken above their 200-week average for the first time, a sign that Bitcoin is acting more like a mature macro asset.
Key Takeaways
- The S&P 500-to-Bitcoin ratio has moved above its 200-week average for the first time and is staying there.
- The Nasdaq/BTC ratio also showed a similar crossover for the first time.
- The move suggests Bitcoin is behaving more like a mature macro asset than a young outperformance trade.
Bitcoin has outpaced stocks and plenty of other assets for years, but a new chart suggests that edge may be narrowing. For the first time, the S&P 500-to-Bitcoin ratio has climbed above its 200-week average and is still holding there, and the same thing has happened with the Nasdaq/BTC ratio. For investors who have mostly viewed Bitcoin as a stronger store of value, that is a meaningful change.
Ratio Breaks Out
The S&P 500-to-Bitcoin ratio measures how much Bitcoin it takes to buy the index. In 2012, that figure was more than 300 BTC. Today, it is around 0.12 BTC. Since Bitcoin launched in 2010, the ratio has generally trended lower, with the 200-week simple moving average acting as a kind of ceiling. Stocks have had earlier stretches of strength versus Bitcoin, but those moves never managed to stay above that level for long.
This time looks different. The latest move above the average has not snapped back quickly, which makes it more technically important than the earlier spikes. The Nasdaq/BTC ratio has now posted a similar crossover for the first time as well.
What This Says About Bitcoin
For macro traders, the signal is that Bitcoin may no longer be delivering the same clear-cut outperformance that defined earlier cycles. The old idea that Bitcoin alone could supercharge a portfolio is facing more resistance. At the same time, the move fits a market that has grown much larger and more established. Bitcoin now has a market cap of more than $1 trillion (€0.9 trillion), and it trades alongside spot ETFs, options, futures, and other structured products.
That kind of scale makes extreme moves harder to repeat. In Bitcoin’s early years, a relatively small market could still double or quadruple quickly, but that gets tougher once the asset is much larger and more closely linked to the broader financial system. The latest stock-to-Bitcoin ratio mostly points to Bitcoin behaving more like a mature macro asset than a young high-beta trade.
Relevant for European Investors
For European crypto readers, the takeaway is that Bitcoin is increasingly being measured against traditional index investing, not just against other tokens. The chart also highlights how much liquidity, derivatives, and ETF access now matter for price action. That makes Bitcoin less of an outlier in how it trades, but easier to understand within the wider market setup.
Bitcoin is also still trailing while stocks push to record highs, which makes the relative shift stand out even more.