Bitcoin Tests May High as Recent Buyers Stay Further Underwater
Glassnode data shows that recent buyers are still well below their average entry price, while the price tests resistance around $82,842 and $83,917.
Key Takeaways
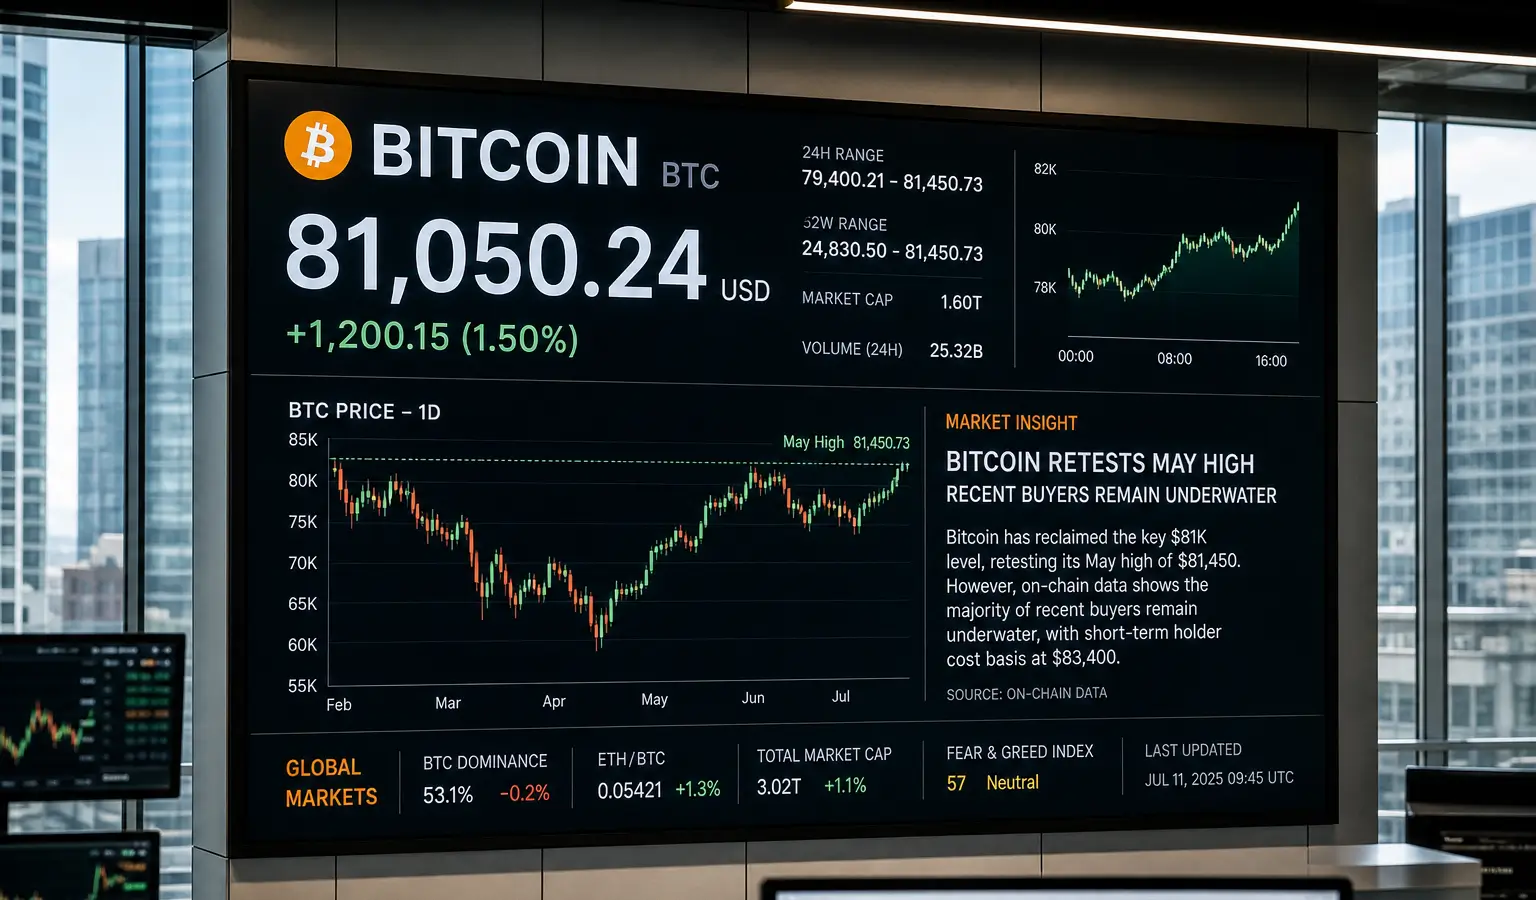
- Bitcoin rose to $81,050 on Friday and returned to the level it last hit on May 14.
- The average purchase price for recent buyers fell to $71,188, giving them a bigger buffer before losses.
- A weekly close above $82,842 would confirm a first higher high; support sits around $69,664 to $71,188.
Bitcoin rose to $81,050 (€69,700) on Friday, putting it back at the level it last touched on May 14. The situation is different for recent buyers, though: their average entry price is now much further below the market price.
On-Chain Floor Keeps Falling
Glassnode data shows that the average purchase price for coins younger than 155 days has dropped sharply. In May, that cost basis was still around $78,713 (€67,700), but now it sits around $71,188 (€61,300). That is a drop of about $7,500 (€6,450) and gives recent buyers more room before they are underwater again.
That gap matters for the cushion around the current price. In May, a 2.9% drop would have pushed the whole group back into losses. That pullback did happen, after which Bitcoin later slid toward the low $60,000 (€51,600) zone. Now, according to the data, the same group has a 12.4% buffer, more than four times as wide.
Profit-Taking Remains Limited
The SOPR also points to a more cautious market picture. The ratio stood at 1.0082 on September 3, which means coins moved on-chain at an average profit of less than 1%. That is much cooler than during earlier breakouts, when SOPR was at 1.086 in November 2024 and 1.179 in July 2025.
At the same time, selling pressure from long-term holders appears limited. Their coins have the biggest unrealized gains, so if they were selling heavily, that should push the ratio clearly higher. Lower weekly volumes and the fact that the recent breakout was not immediately repeated fit with a market where participation remains thin.
Key Levels for Bitcoin
On the weekly chart, Bitcoin is trying to break a pattern of lower highs and lower lows that has been visible since the record high of $126,200 (€108,600). The price has now formed a higher low and is still 35.8% below that all-time high.
A weekly close above $82,842 (€71,300) would confirm the first higher high since the record. The recent weekly peak was $82,285 (€70,800), so the price is still about $557 (€479) below that level. Above that, resistance sits around $83,917 (€72,200), the 0.382 Fibonacci level.
On the downside, the zone around $69,664 (€59,900) to $71,188 (€61,300) is tightly defined. That is where the 200-day average, the 0.5 Fibonacci level, and the on-chain cost basis for recent buyers sit close together. For European crypto followers, that matters because levels like these often show where the market can quickly change direction, even if they do not yet tell us which way it will go.
Momentum is still mixed for now. The daily RSI is around 72 after peaking at 78 at the end of August, which points to fading short-term strength. The weekly RSI around 60 still leaves room, though. For now, the main question is whether Bitcoin can close above $82,842 (€71,300), or whether the price falls back toward the zone around $71,188 (€61,300).