Bitcoin Closes Above 50-Week Average After 45 Weeks
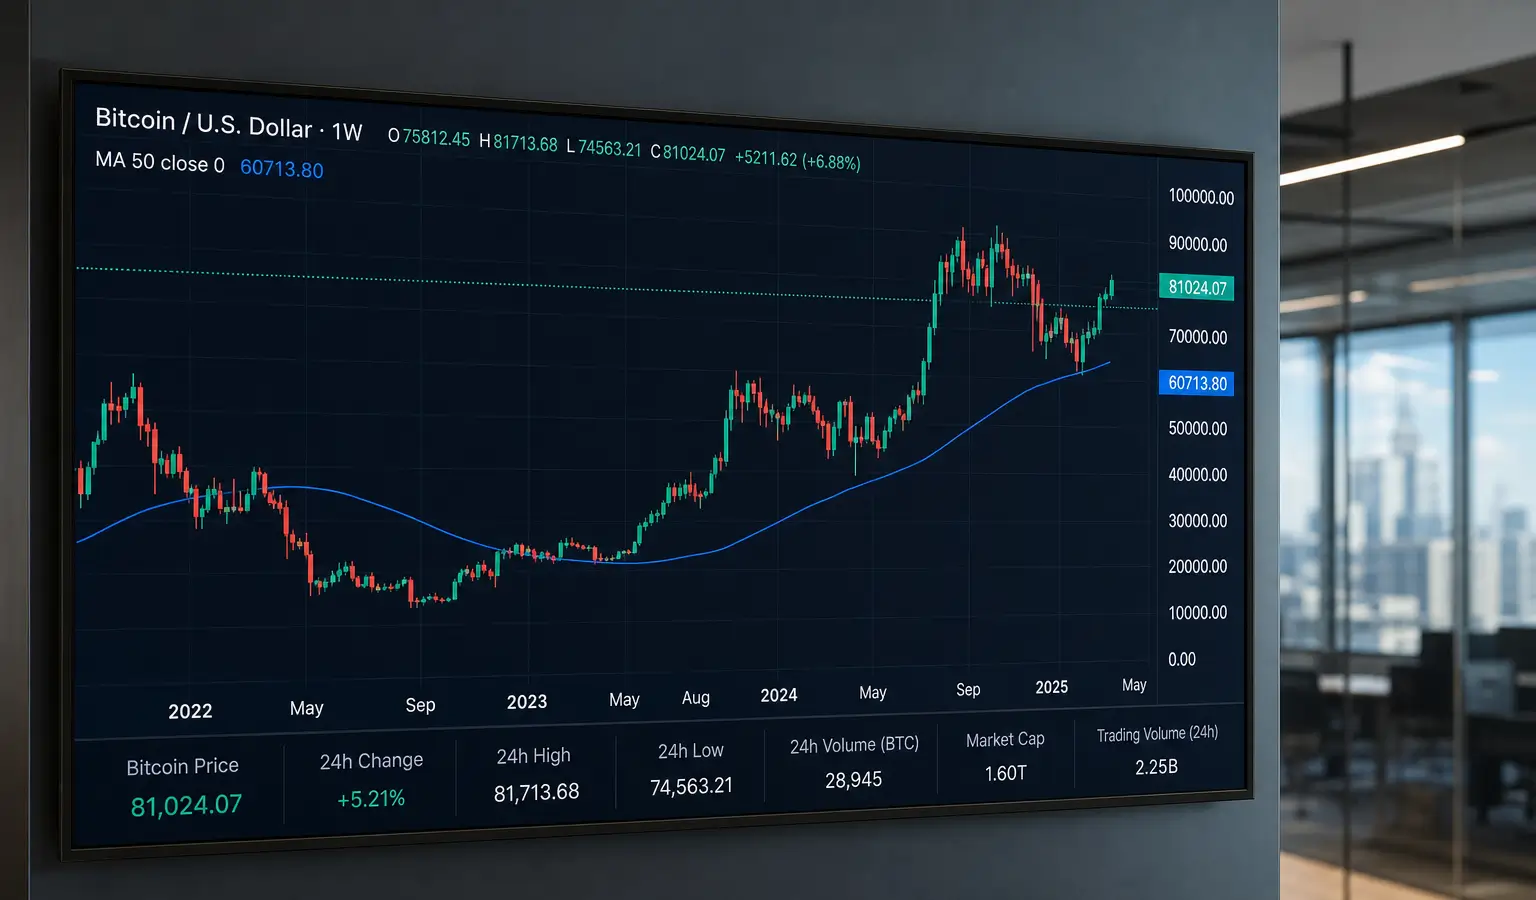
Bitcoin closed above the 50-week average for the first time in 45 weeks, a level Galaxy Research sees as possible confirmation of a new uptrend.
Key Takeaways
- Bitcoin closed the week ending September 20 above the 50-week average for the first time in 45 weeks.
- The price rose nearly 6% in a week and was around $81,000, after climbing about 29% in 35 days.
- Galaxy Research sees the weekly close above this average as a possible sign that the bear market is over.
Bitcoin closed the week ending September 20 above the 50-week average for the first time in 45 weeks. According to Galaxy Research, that could be an important sign that the bear market is behind us and that a new uptrend has started.
The price rose nearly 6% during the week and was around $81,000 (€70,700). That means Bitcoin gained about 29% in 35 days. What matters most is that the weekly candle actually closed above the average, instead of just briefly moving above it.
Why This Close Matters
Bitcoin trades day and night, but the week closes on Sunday at 11:59 p.m. UTC. Analysts often place more weight on a close above an important moving average than on a brief break through it. The 50-week average is simply the average of weekly closing prices over about a year and is seen as a measure of the long-term trend.
During weak periods, that line often acts as a ceiling. In stronger periods, Bitcoin stays above it. Galaxy has therefore long described the average as a level that is hard to reclaim during major selloffs.
Historically Important Level
Galaxy looked at major Bitcoin drawdowns since 2011 and found that in 13 cases, Bitcoin did not go on to set a new low 11 times after closing back above the 50-week average. In earlier cycles, that kind of recovery often lined up with the end of a bear market.
The examples are familiar. After the 2011 crash, Bitcoin reclaimed the line in January 2012 and later went on to a huge bull market. After the 2014 and 2015 bear market, it happened again in October 2015, followed by the run to nearly $20,000 (€17,500) in December 2017. Bitcoin also moved back above the average in May 2019 and March 2023 before the price kept climbing.
At the same time, history also warns about false signals. Two of the 13 times, Bitcoin failed to hold onto the recovery, both during the volatile period around late 2021 and early 2022. Back then, Bitcoin later fell back toward $16,000 (€14,000).
What Investors Can Take From This
For European crypto followers, this is especially relevant because the 50-week average is a widely used gauge of Bitcoin's health. A weekly close above it can suggest the market is stronger than it was in the months before, but it is still a technical signal, not a guarantee of the next move.
At the time of writing, Bitcoin was around $81,450 (€71,100), while the 50-week average stood at $78,115 (€68,200). That shows the price has not only touched the line, but is also staying above it for now.
The $80,000 to $82,000 zone also played an important role earlier, because there was a lot of supply there and the price was still trading below the 50-week average at the time.